| :
Introduction |
||
 |
|
|
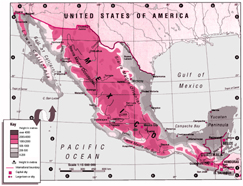
Thirty-seven of the assessment tasks presented students with completed graphs, tables or maps and asked them to extract and interpret particular information.
Fifteen tasks were completely or largely the same for year 4 and year 8 students. Four of these are trend tasks (fully described with data for both 1995 and 1999), six are released tasks (fully described with data for 1999 only), and five are link tasks (to be used again in 2003 so only partially described here). Eight other tasks, including two trend tasks and three link tasks, were attempted only by year 4 students. The remaining fourteen tasks, including four trend tasks and five link tasks, were attempted only by year 8 students.
The tasks were presented to students in three formats. Eight tasks involved more complex instructions or required more extended responses. These were administered in one-to-one interview format. Twenty-four tasks were presented in station format. The remaining five tasks were presented in independent format.
The task details and results for trend tasks are presented in the first section, followed by the task details and results for released tasks. The third section contains a little task information and the results for the link tasks. Within each of the three sections, tasks used with both year 4 and year 8 students are presented first, followed by tasks used only with year 4 students and then by tasks used only with year 8 students.
Comparing
results for year 4 and year 8 students
Averaged across 63 task components used with both year 4 and year 8 students,
80 percent of year 8 students produced correct responses compared to 60 percent
of year 4 students. This indicates that, on average, students have made substantial
progress between year 4 and year 8 in the skills assessed by the tasks. More than
one third of the task components were answered successfully by at least 90 percent
of year 8 students. It is reassuring to note that some of the largest differences
between year 4 and year 8 students occurred with line graphs, which are generally
not taught until after year 4.
Trend
results: comparing 1995 and 1999 results
Six trend tasks involving 19 task components were administered to year
4 students in both the 1995 and 1999 assessments. More 1999 than 1995 students
succeeded on 13 components, while more 1995 than 1999 students succeeded on 3
components. Averaged across all 19 components, 3 percent more students succeeded
in 1999 than in 1995. This indicates a small improvement in performance for year
4 students over the four year period.
Eight trend tasks involving 32 task components were administered to year 8 students in both the 1995 and 1999 assessments. More 1999 than 1995 students succeeded on 9 components, while more 1995 than 1999 students succeeded on 15 components. Averaged across all 32 components, 2 percent fewer students succeeded in 1999 than in 1995. This indicates a very small decline in performance for year 8 students over the four year period.
|
|
||