| Approach: Independent |
Level:
Year 4 |
|
| Focus:
Interpreting
a bar graph
|
| Resources:
Bar graph in
resource book, red pen |
 |
164KB |
|
|
Questions/instructions:
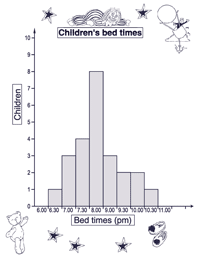
The children
in the class made a graph showing their bed times. |
 [click
on to enlarge]
 |
|
| |
%
responses
2003 ('99) |
| y4
|
| 1.
What is the earliest bed time? |
6:30
(pm) |
51
(49) |
| 2.
How many children go to bed at 7:30? |
4
|
78
(76) |
| 3.
What time do most children go to bed? |
8
(pm) |
85
(85) |
| 4.
How many more children go to bed at 8.00 than 7.30? |
4
|
65
(61) |
| |
|
Total
score:
|
4
|
36
(34) |
3
|
33
(29) |
2
|
14
(19) |
1
|
9
(10) |
0
|
8
(8) |
Commentary:
There is no change between 1999 and 2003 in year 4 students’ ability
to read a simple bar graph. About a third of year 4 students answered
all questions accurately. |