| Approach: Station |
Level:
Year 4
and year 8 |
|
| Focus:
Interpreting
a graph
|
| Resources:
Graph in
recording book |
 |
104KB |
|
|
Questions/instructions:
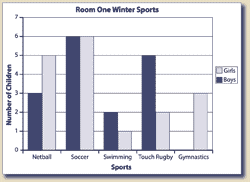
Look at the graph. It shows the sports that children in Room One
play in the winter. |
 [click
on graph to enlarge]
 |
|
| |
%
responses |
y4 |
y8 |
1.
What are two things this graph tells you about soccer?
|
the
same number of boys and girls play soccer |
20
|
39 |
six
boys play soccer |
18
|
17 |
six
girls play soccer |
17
|
17 |
soccer
is most popular (for boys, girls, both) |
28
|
46 |
2.
Which sports do girls play more than boys?
|
netball
|
82
|
89 |
gymnastics
|
30
|
55 |
| 3.
More boys play touch rugby than girls. How many more? |
3
|
58
|
83 |
| 4.
How many children go swimming? |
3 |
68 |
93 |
| |
|
|
|
Total
score:
|
6–8
|
7
|
21 |
4–5
|
36
|
56 |
2–3
|
37
|
19 |
0–1
|
20 |
4 |
Commentary:
Year 8 students
were more successful than year 4 students in interpreting the graph. About
75 percent of year 8 students scored six or more of the items correctly,
compared with 43 percent of year 4 students.
|