| Approach: One
to one |
Level:
Year 8 |
|
| Focus:
Interpreting
a table and a graph
|
| Resources:
Chart with table
|
 |
628KB |
|
|
Questions/instructions:
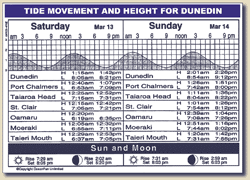
Give student tide chart.
This chart gives information about tides, the sun and moon.
H means high tide and L means
low tide. |
 [click
on chart to enlarge]
 |
|
| |
%
responses
2003 ('99) |
|
y8
|
1.
Look for Sunday, March 14th.
At what time in the afternoon will it be high tide at
Port Chalmers? |
1.51pm
|
57
(70) |
2.
Look at Saturday, March 13th. Imagine that you want to catch low tide
at St.Clair. What times would you catch a low tide?
|
Correct
choices: 7.05am & 7.21pm |
|
7.05am
|
88
(88) |
7.21pm
|
74
(81) |
3.
The tide chart also has information about the sun and the moon. Look at
the moon for Saturday, March 13th.
Try to tell me three things about the moon on this date.
|
rises
at 2.02am |
79
(83) |
sets
at 5.20pm |
78
(84) |
is
a crescent / moon |
12
(49) |
|
Point to Saturday 13 March tide section of the graph. |
|
4.
Now look at the graph for Saturday March 13th.
What is happening between 2 am and 6 am? |
tide is going out |
59
(55) |
5.
Who might find this chart helpful?
|
people
who need to know about the level of the sea (or examples
of such people) |
85
(70) |
| |
|
|
Total
score:
|
8–9
|
27
(42) |
6–7
|
46
(37) |
4–5
|
19
(14) |
2–3
|
6
(5) |
0–1
|
2
(2) |
Commentary:
There was a slight decline in year 8 students’ ability to interpret
aspects of related material presented in a table and a graph from 1999
to 2003. Overall, 27 percent of students in 2003 compared with 42 percent
in 1999 scored more than seven overall. |