|
||||||||||||||||||||
|
||||||||||||||||||||
%
responses 2007 ('03) |
||||||||||||||||||||
y4 |
y8 |
|||||||||||||||||||
| Mentioned in title: |
(class) points |
44 (50) |
77 (86) |
|||||||||||||||||
earned (or similar) |
2 (1) |
8 (10) |
||||||||||||||||||
in a week |
2 (2) |
11 (12) |
||||||||||||||||||
| Position of title: |
above graph |
47 (53) |
73 (86) |
|||||||||||||||||
below graph |
4 (8) |
5 (5) |
||||||||||||||||||
| Appropriate side axis label: (e.g, class points, points, points earned) | 14 (11) |
50 (67) |
||||||||||||||||||
| Appropriate bottom axis label: (days, week days) | 15 (14) |
50 (68) |
||||||||||||||||||
| Line on graph: |
Wednesday – |
marked at 80 |
26 (25) |
61 (69) |
||||||||||||||||
Thursday – |
marked at 90, or up 10 from Wednesday |
23 (23) |
62 (70) |
|||||||||||||||||
Friday – |
marked at 110, or up 20 from Thursday |
23 (21) |
61 (69) |
|||||||||||||||||
| Line drawn: (marks/dots connected up with line) |
with all points correct |
11 (18) |
56 (64) |
|||||||||||||||||
not all points correct |
41 (40) |
32 (30) |
||||||||||||||||||
Total
score: |
11–12 |
0 (0) |
31 (11) |
|||||||||||||||||
9–10 |
5 (5) |
18 (40) |
||||||||||||||||||
7–8 |
7 (8) |
16 (18) |
||||||||||||||||||
5–6 |
18 (16) |
18 (16) |
||||||||||||||||||
0–4 |
71 (71) |
18 (15) |
||||||||||||||||||
| Subgroup Analysis [Click on charts to enlarge] : |
Year 4 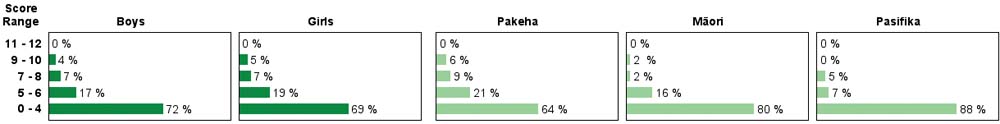 |
||
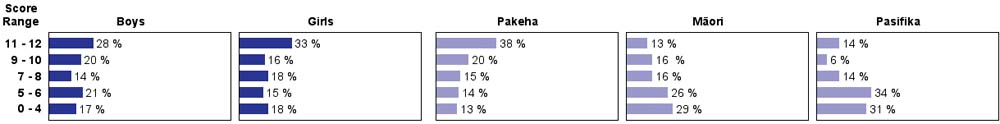
| Commentary: |
| Year 8 students performed moderately well on this task, but year 4 students had great difficulty with it. Only about one in ten year 4 students could complete the line of the graph successfully, where slightly over half of the year 8 students were able to do so. Year 4 students performed very similarly in 2003 and 2007, but there were more very high performing year 8 students in 2007 than in 2003. At year 8 level especially, Pakeha students performed better than Mäori and Pasifika students. |