|
|||||||||||||||||||||||||||||||||||
|
|||||||||||||||||||||||||||||||||||
%
responses |
|||||||||||||||||||||||||||||||||||
y8 |
|||||||||||||||||||||||||||||||||||
Jan: |
marked at $10 |
90 |
|||||||||||||||||||||||||||||||||
Feb: |
marked at $20 (±1) |
72 |
|||||||||||||||||||||||||||||||||
Mar: |
marked at $10 (±1) |
72 |
|||||||||||||||||||||||||||||||||
Apr: |
marked at $5 (±1) |
74 |
|||||||||||||||||||||||||||||||||
May: |
marked at $20 (±1) |
72 |
|||||||||||||||||||||||||||||||||
Jun: |
marked at $25 (±1) |
74 |
|||||||||||||||||||||||||||||||||
| Line drawn: (i.e. squares, marks, dots connected up with line) |
marked tidily between marked points |
51 |
|||||||||||||||||||||||||||||||||
marked but quite roughly |
39 |
||||||||||||||||||||||||||||||||||
| Line appropriately labelled: |
positioned with and labelled like Tom and Mary |
53 |
|||||||||||||||||||||||||||||||||
labelled but in another way |
4 |
||||||||||||||||||||||||||||||||||
Total
score: |
10 |
29 |
|||||||||||||||||||||||||||||||||
8–9 |
27 |
||||||||||||||||||||||||||||||||||
6–7 |
19 |
||||||||||||||||||||||||||||||||||
4–5 |
11 |
||||||||||||||||||||||||||||||||||
0–3 |
15 |
||||||||||||||||||||||||||||||||||
| Subgroup Analysis [Click on charts to enlarge] : |
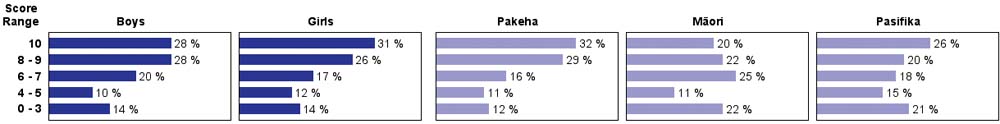
| Commentary: |
| Year 8 students were moderately successful on this task, with over half of the students scoring 8 or better. They were generally successful at finding the points on the graph but had somewhat more difficulty with line drawing and labelling. Gender and ethnic differences were quite small. |