|
|||||||||||||
|
|||||||||||||
%
responses 2007 ('03) |
|||||||||||||
y4 |
y8 |
||||||||||||
|
|||||||||||||
| Key drawn & labelled correctly: | hut |
53 (61) |
81 (83) |
||||||||||
tree |
54 (66) |
82 (87) |
|||||||||||
cave |
50 (58) |
77 (80) |
|||||||||||
lake |
54 (65) |
82 (86) |
|||||||||||
stream |
48 (62) |
78 (80) |
|||||||||||
| Map drawn & labelled correctly: (within marked area) |
hut |
38 (47) |
80 (75) |
||||||||||
tree |
49 (57) |
87 (87) |
|||||||||||
cave |
57 (63) |
87 (78) |
|||||||||||
lake |
30 (31) |
64 (70) |
|||||||||||
stream (anything joining lake to Captain’s Beach) |
27 (22) |
56 (64) |
|||||||||||
Total
score: |
9–10 |
14 (18) |
56 (60) |
||||||||||
7–8 |
22 (32) |
22 (17) |
|||||||||||
5–6 |
16 (15) |
7 (11) |
|||||||||||
3–4 |
13 (8) |
7 (7) |
|||||||||||
0–2 |
35 (28) |
8 (6) |
|||||||||||
| Subgroup Analysis [Click on charts to enlarge] : |
Year 4 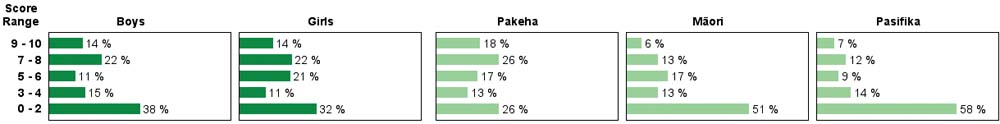 |
||
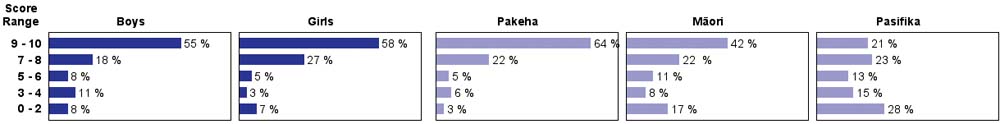
| Commentary: |
| There was strong growth from year 4 to year 8 in the ability to complete a map with appropriate symbols in the proper locations. Year 8 students were generally quite good at this task. There was a slight decline in performance for year 4 students from 2003 to 2007. Mäori and Pasifika year 4 students performed comparably, but Mäori students did better at year 8 level. |