|
||||||||||||
|
||||||||||||
%
responses 2007 ('03) |
||||||||||||
y8 |
||||||||||||
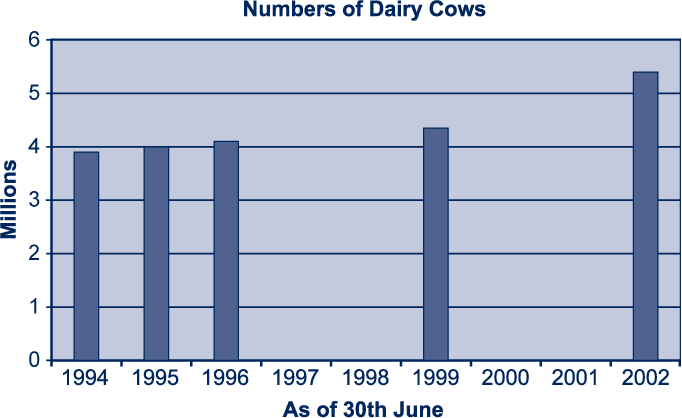
| Look at this graph carefully [Numbers of Dairy Cows]. 1. Write three facts about dairy cows in New Zealand. |
||||||||||||
3 correct facts |
24 (21) |
|||||||||||
2 correct facts |
26 (35) |
|||||||||||
1 correct fact |
23 (20) |
|||||||||||
identified that graph shows no cows in some years |
23 (26) |
|||||||||||
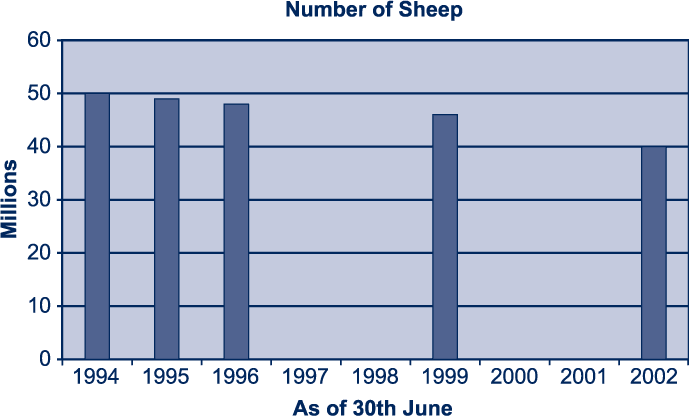
| Now look at the Cows graph and the Sheep graph. 2. How has farming in New Zealand changed between 1994 and 2002? |
||||||||||||
used both graphs and recorded a change over time (cows increased and sheep decreased) |
22 (31) |
|||||||||||
used one graph and recorded a change over time (cows increased or sheep decreased) |
41 (37) |
|||||||||||
response included an incorrect interpretation |
20 (19) |
|||||||||||
Total
score: |
6 |
11 (14) |
||||||||||
5 |
20 (23) |
|||||||||||
4 |
14 (15) |
|||||||||||
3 |
22 (21) |
|||||||||||
0–2 |
33 (27) |
|||||||||||
| Subgroup Analysis [Click on charts to enlarge] : |
Year 8 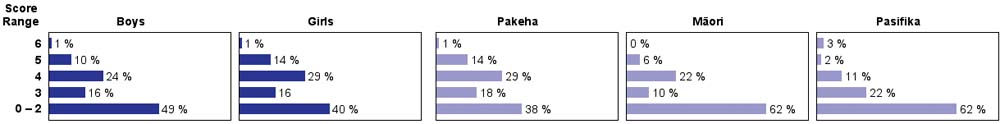 |
| Commentary: |
| Many year 8 students had some difficulty in interpreting bar graphs where there were gaps in the graph. Performance declined slightly from 2003 to 2007. Pasifika students, in particular, had little success with this task. |