|
|||||||||||||
|
|||||||||||||
%
responses 2007 ('03) |
|||||||||||||
y4 |
y8 |
||||||||||||
| 1. How much money has he saved by the 29th of June? |
|||||||||||||
$30 |
20 (21) |
70 (65) |
|||||||||||
30 |
3 (2) |
3 (0) |
|||||||||||
29 or $29 |
3 (5) |
6 (5) |
|||||||||||
| 2. How much money did Sam save between the 1st and the 8th of June? |
|||||||||||||
$4 |
13 (17) |
45 (39) |
|||||||||||
4 |
4 (4) |
2 (3) |
|||||||||||
| 3. Sam was given $8 for his birthday. He saved this money. Between which dates do you think he had his birthday? |
|||||||||||||
8th and 15th June |
13 (11) |
47 (45) |
|||||||||||
| 4. What will the line on the graph look like if he doesn’t
save any money next week? Tick your answer. |
|||||||||||||
| a. go up | 10 (11) |
4 (4) |
|||||||||||
| b. go down | 35 (28) |
14 (14) |
|||||||||||
|
43 (58) |
79 (80) |
|||||||||||
Total
score: |
4 |
2 (2) |
28 (21) |
||||||||||
3 |
7 (7) |
23 (25) |
|||||||||||
2 |
20 (20) |
25 (26) |
|||||||||||
1 |
29 (44) |
16 (21) |
|||||||||||
0 |
43 (27) |
8 (7) |
|||||||||||
| Subgroup Analysis [Click on charts to enlarge] : |
Year 4 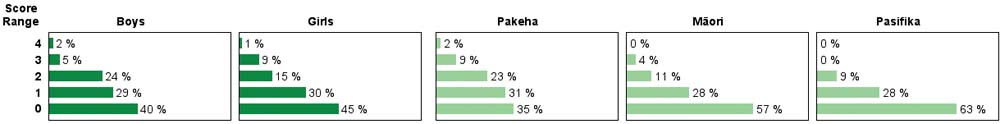 |
||
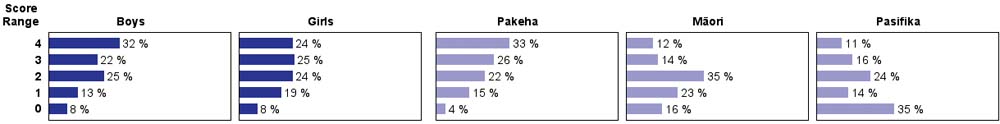
| Commentary: |
| Year 4 students had great difficulty with this task involving interpreting a line graph. Year 8 students were substantially better, but still not strong. In particular, students had difficulty in working from given information back to the graph. There was little change from 2003. |