|
||||||||||||
|
||||||||||||
%
responses 2007 ('03) |
||||||||||||
y8 |
||||||||||||
| Here are two graphs. They show how
much time New Zealand teenagers
spend on different activities. Hand out graph A. This graph shows how long each day 12 to 13 year olds spend on different activities. The bars show girls and boys on different activities. |
||||||||||||
| 1. Which activity has the biggest time difference between boys and girls? |
||||||||||||
sports and hobbies |
83 (79) |
|||||||||||
Place graph B beside graph A. 2. Which activity do boys spend a lot less time doing as they get older? |
||||||||||||
sports and hobbies |
46 (41) |
|||||||||||
| 3. How does the time boys and girls spend looking after others change as they get older? |
||||||||||||
girls spend more time/bar goes higher |
69 (67) |
|||||||||||
boys spend less time/bar goes lower |
68 (67) |
|||||||||||
Total
score: |
4 |
37 (31) |
||||||||||
3 |
26 (27) |
|||||||||||
2 |
14 (17) |
|||||||||||
1 |
14 (13) |
|||||||||||
0 |
9 (11) |
|||||||||||
| Subgroup Analysis [Click on charts to enlarge] : |
Year 8 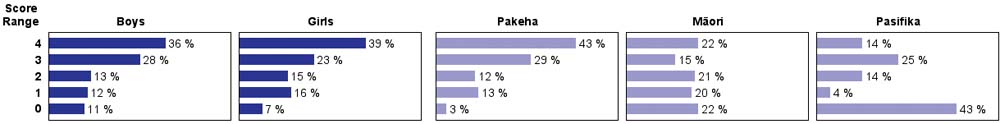 |
||
| Commentary: |
| Most year 8 students were able to extract basic information from a bar chart, but many had some difficulty when required to interpret a trend. There was little change from 2003 to 2007. Almost half of the Pasifika students had no success with this task. |