|
Questions / instructions:
| Here are
some labels that say |
Girls |
Boys |
Girls
and boys |
Put them on the desk
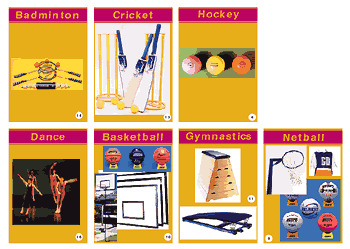
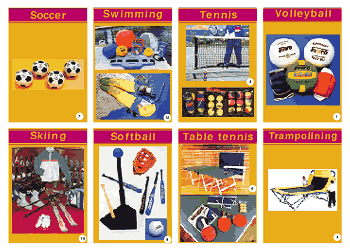
I am going to give you some pictures that show some different sports.
Give the student the pictures
(keep back rugby picture).
 
Look at each picture
and think about who would be more likely to play this sport. Would it be girls,
boys or both? Place each picture under the label where you think it belongs. Do
that now.
Write student responses
on recording sheet.
Where students responses are spread over two or more categories say:
Now let's look at each
group.
Point to "boys" pile
of cards.
1. Can you explain why boys are more likely than girls to play these sports?
Point to "girls"
pile of cards.
2. Can you tell me why girls are more likely than boys to play these sports?
|
|
Marked 1
if "Girls" chosen, 2 if "Girls and boys" chosen, 3 if "Boys" chosen.
Mean scores
are calculated for both boys and girls: the closer the mean score is to 1, the
more students labelled it as a girls sport; closer to 2 the more labelled it as
a sport for both boys and girls; closer to 3, the more students labelled it as
a boys sport.
SPORTS:
netball
dance
gymnastics
volleyball
badminton
trampolining
tennis
table tennis
swimming
skiing
hockey
softball
soccer
basketball
cricket
|

1.14
1.39
1.54
1.74
1.89
1.96
2.02
2.06
2.06
2.18
2.20
2.51
2.64
2.73
2.75 |

1.13
1.41
1.37
1.87
2.06
1.91
1.94
2.06
1.99
2.09
2.25
2.54
2.69
2.66
2.77 |

1.06
1.41
1.39
2.00
1.97
1.87
2.01
2.24
1.97
2.04
1.94
2.50
2.71
2.69
2.73
|

1.07
1.39
1.35
1.94
1.98
1.79
2.01
2.13
2.00
2.07
2.02
2.54
2.67
2.59
2.75 |
|
Commentary
The results show remarkable consistency across year 4 and year 8 in the views
of boys and girls. All four groups classified netball, dance and gymnastics as
predominantly girls sports, and cricket, basketball, soccer and softball as predominantly
boys sports. The percentage viewing rugby as a boys sport declined from year 4
to year 8, and was relatively low. Many students gave as their reason the very
recent success of the NZ women's team.
|