|
|||||||||||||||||
%
responses 2009 ('05) |
|||||||||||||||||
y4 |
y8 |
||||||||||||||||
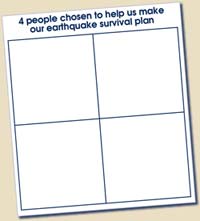
| First response given: [These are the responses for the first person the teams selected. The responses for the other three selections show a similar pattern.] |
librarian |
5 (0) |
3 (2) |
||||||||||||||
civil engineer |
6 (7) |
16 (9) |
|||||||||||||||
householder |
17 (23) |
14 (19) |
|||||||||||||||
Civil Defence worker |
17 (16) |
13 (7) |
|||||||||||||||
great-grandparent |
13 (12) |
9 (7) |
|||||||||||||||
doctor |
5 (7) |
1 (3) |
|||||||||||||||
first-aid teacher |
10 (7) |
14 (12) |
|||||||||||||||
builder |
1 (0) |
1 (0) |
|||||||||||||||
rescue worker |
4 (7) |
4 (5) |
|||||||||||||||
seismologist |
17 (19) |
20 (24) |
|||||||||||||||
OSH worker |
3 (2) |
6 (12) |
|||||||||||||||
teacher |
2 (0) |
0 (0) |
|||||||||||||||
anything else (or none) |
1 (0) |
0 (0) |
|||||||||||||||
| Justification for
choosing person 1: |
very strong |
7 (11) |
14 (17) |
||||||||||||||
reasonable (specific to school needs) |
21 (18) |
40 (26) |
|||||||||||||||
weak |
28 (32) |
28 (29) |
|||||||||||||||
only read card or no response |
44 (40) |
18 (28) |
|||||||||||||||
| Justification for
choosing person 2: |
very strong |
8 (5) |
12 (12) |
||||||||||||||
reasonable (specific to school needs) |
13 (20) |
27 (28) |
|||||||||||||||
weak |
23 (21) |
31 (35) |
|||||||||||||||
only read card or no response |
56 (54) |
30 (26) |
|||||||||||||||
| Justification for
choosing Person 3: |
very strong |
4 (9) |
12 (9) |
||||||||||||||
reasonable (specific to school needs) |
26 (5) |
28 (29) |
|||||||||||||||
weak |
21 (30) |
28 (35) |
|||||||||||||||
only read card or no response |
50 (56) |
32 (28) |
|||||||||||||||
| Justification for
choosing person 4: |
very strong |
3 (4) |
18 (7) |
||||||||||||||
reasonable (specific to school needs) |
18 (7) |
35 (32) |
|||||||||||||||
weak |
23 (35) |
23 (35) |
|||||||||||||||
only read card or no response |
57 (54) |
24 (26) |
|||||||||||||||
Total
score: |
8–12 |
7 (5) |
22 (19) |
||||||||||||||
6–7 |
11 (7) |
26 (25) |
|||||||||||||||
4–5 |
19 (21) |
25 (21) |
|||||||||||||||
2–3 |
32 (32) |
18 (21) |
|||||||||||||||
0–1 |
31 (34) |
8 (14) |
|||||||||||||||
| Commentary: |
| This was a difficult task for the year 4 children, with most teams not being able to come up with any justification for their choices, or only a weak response. There was marked improvement in the year 8 teams. The selections that students made were fairly similar at year 4 and year 8. Slight growth in the quality of the justifications was seen at both levels over the previous administration. Subgroup comparisons are not possible because this was a team task. |

