|
||||||||||||||||
|
||||||||||||||||
%
responses 2009 ('05) |
||||||||||||||||
y8 |
||||||||||||||||
Step 1: |
C |
80 (76) |
||||||||||||||
Step 2: |
E |
69 (70) |
||||||||||||||
Step 3: |
F |
62 (61) |
||||||||||||||
Step 4: |
H |
69 (61) |
||||||||||||||
Step 5: |
J |
73 (73) |
||||||||||||||
Step 6: |
L |
79 (68) |
||||||||||||||
Total
score: |
6 |
14 (9) |
||||||||||||||
5 |
34 (32) |
|||||||||||||||
4 |
30 (31) |
|||||||||||||||
3 |
16 (18) |
|||||||||||||||
0–2 |
7 (11) |
|||||||||||||||

| Subgroup Analysis [Click on charts to enlarge] : |
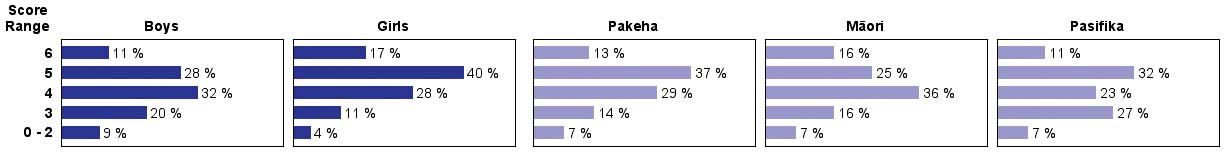
| Commentary: |
| Performance was quite mixed on this task, with some students doing quite well and others having difficulty. Modest growth was seen in performance from the 2005 administration. Girls outperformed boys; differences by ethnicity were small. |