|
||||||||||||||||
|
||||||||||||||||
%
responses 2009 ('05) |
||||||||||||||||
y4 |
y8 |
|||||||||||||||
 |
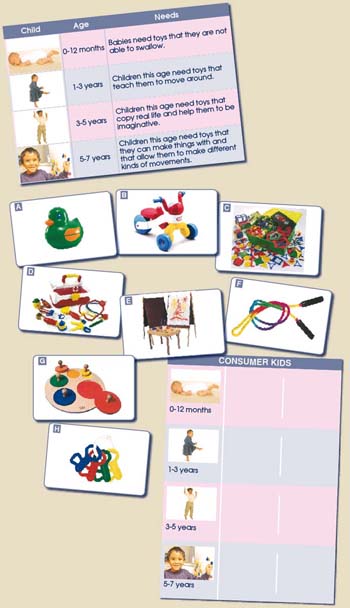
1. For a child who was 0–12 months old I would choose toy and toy . | |||||||||||||||
Chose: |
A |
87 (90) | 90 (95) | |||||||||||||
and: |
H |
77 (84) | 88 (89) | |||||||||||||
| 2. For a child who was 1–3 years old
I would choose toy and toy . |
||||||||||||||||
Chose: |
B |
77 (78) | 82 (88) | |||||||||||||
and: |
G |
57 (62) | 71 (72) | |||||||||||||
| 3. For a child who was 3-5 years old
I would choose toy and toy . |
||||||||||||||||
Chose: |
D |
61 (59) | 70 (74) | |||||||||||||
and: |
E |
60 (61) | 60 (70) | |||||||||||||
| 4. For a child who was 5-7 years old
I would choose toy and toy . |
||||||||||||||||
Chose: |
C |
71 (70) | 73 (78) | |||||||||||||
and: |
F |
67 (69) | 62 (72) | |||||||||||||
Total
score: |
8 |
23 (26) |
33 (43) |
|||||||||||||
6–7 |
34 (37) |
36 (31) |
||||||||||||||
4–5 |
33 (28) |
22 (22) |
||||||||||||||
2–3 |
9 (7) |
3 (2) |
||||||||||||||
0–1 |
2 (2) |
5 (1) |
||||||||||||||
| Subgroup Analysis [Click on charts to enlarge] : |
| Commentary: |
| Many children were successful on this task, at both year 4 and year 8. Modest growth was seen between year 4 and year 8, but students did not perform as well in 2009 as in 2005. Pasifika students had more difficulties with this task, and girls outperformed boys, especially at year 8 level.
|

