|
Approach: Independent
|
| Focus:
Interpreting a time/distance
line graph. |
 |
108k |
Resources: None |
Questions
/ instructions:
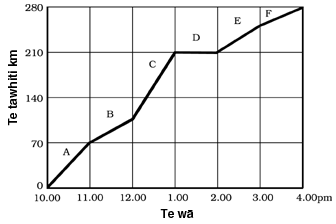
Kate went on a car trip with
her family. Back at school Kate made a graph to show how far her family travelled
and how long it took them. |
I
haere a Keita me töna whänau ki tëtahi hararei mä runga motokä.
I te hokinga mai o Keita ki te kura ka hangaia e ia he kauwhata hei whakaatu i
pëhea rawa te tawhiti o tä rätou haere ko tana whänau, ä,
e hia häora te roa. |
|
|
 |
|
 |
|
|
%
responses
|
|
GEd
|
MI
|
| Look
at the graph to help you answer the questions. |
79
|
64
|
| Tirohia
te kauwhata hei äwhina i a koe ki te whakahoki i ngä pätai. |
| 1.
How far did Kate's family travel in the first hour? |
|
I te häora tuatahi i
pëhea te tawhiti o te haere a Keita me töna whänau? |
| |
70
km
|
|
70
|
10
|
16
|
| 2.
Which letter on the graph shows when the family stopped for lunch? |
39
|
52
|
| Ko
tëhea pü i te kauwhata e whakaatu ana nö nahea te whänau i
tau ai ki te kai? |
| |
D
|
| 3.
Which letter on the graph shows when they travelled the fastest? |
51
|
58
|
| Ko
tëhea pü i te kauwhata e whakaatu ana i te tino tere rawa o tä
rätou haere? |
| |
C
|
| 4.
How far had they gone after 3 hours? |
57
|
32
|
|
I
pëhea te tawhiti o tä rätou haere i te hipatanga o te toru häora?
|
| |
210
km
|
|
210
|
11
|
26
|
|
Total
score:
|
5–6
|
39
|
34
|
|
3–4
|
37
|
36
|
|
1–2
|
20
|
20
|
|
0
|
4
|
10
|
Commentary:
Overall, the results obtained by MI (Mäori Immersion) and GEd (General Education)
students were not statistically significantly different. |