|
||||||||||||||||
|
||||||||||||||||
%
responses 2009 ('05) |
||||||||||||||||
y4 |
y8 |
|||||||||||||||
1.  |
||||||||||||||||
|
77 (68) | 85 (80) | ||||||||||||||
2.  |
||||||||||||||||
|
18 (7) | 47 (46) | ||||||||||||||
| 40 (43) | 27 (18) | |||||||||||||||
3.  |
||||||||||||||||
|
55 (51) | 77 (71) | ||||||||||||||
4.  |
||||||||||||||||
|
18 (10) | 52 (54) | ||||||||||||||
| 50 (49) | 29 (23) | |||||||||||||||
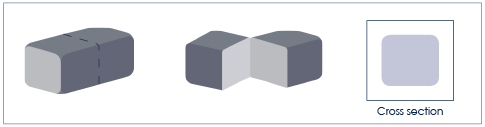
| (semicircle, circle, etc) | ||||||||||||||||
Total
score: |
4 |
9 (2) | 40 (40) | |||||||||||||
| 3
|
14 (11) | 17 (18) | ||||||||||||||
| 2
|
33 (35) | 20 (12) | ||||||||||||||
| 1
|
24 (24) | 10 (13) | ||||||||||||||
| 0 | 20 (28) | 13
(17) |
||||||||||||||
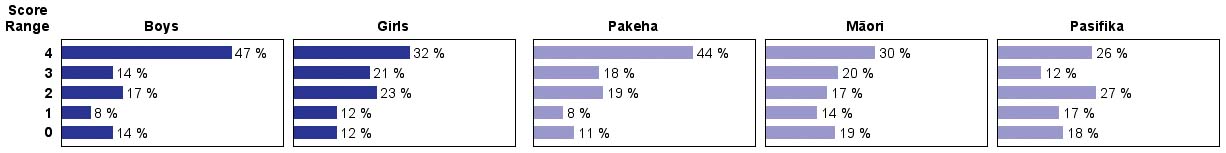
| Subgroup Analysis [Click on charts to enlarge] : |
Year 4 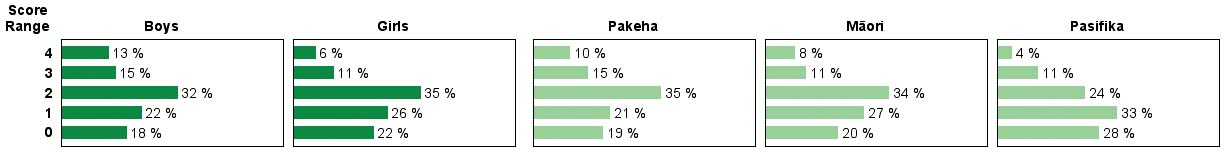 |
||
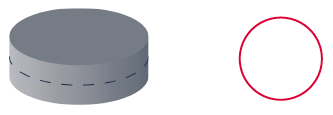
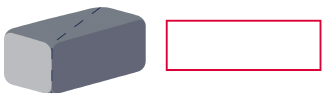
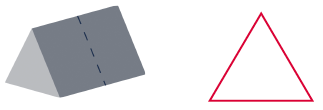
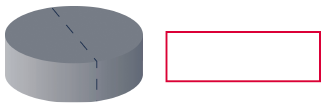
| Commentary: |
| The
second and fourth shapes caused greater visualisation problems than
the other two, with many students seeing the surface rather than the
cross section. Year 4 students scored a little higher in 2009 than
in 2005, but there was little change for year 8 students. Year 4 Pakeha
and Mäori students performed similarly. |