|
|||||||||||||||||
 |
|
||||||||||||||||
%
responses 2009 ('05) |
|||||||||||||||||
y4 |
y8 |
||||||||||||||||
| 1.
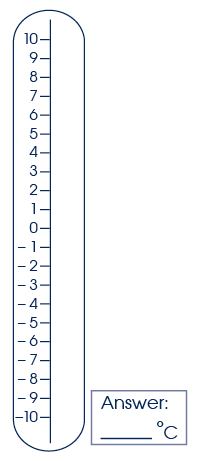
On May 19th, it was 10 What temperature did it get to on the 20th May? |
4 |
59 (61) | |||||||||||||||
| 2.
In Auckland, it was 10 What is the temperature difference between Auckland and Mt Cook? |
17 |
51 (56) | |||||||||||||||
| Total score: | 2
|
40 (43) | |||||||||||||||
| 1
|
30 (30) | ||||||||||||||||
| 0
|
30
(27) |
||||||||||||||||
| Subgroup Analysis [Click on charts to enlarge] : |

| Commentary: |
| With
the temperature scales available, more than half of the students managed
each computation. Performance was very similar in 2005 and 2009. On average,
Pakeha students scored higher than Mäori or Pasifika students. |