|
||||||||||||||||
|
||||||||||||||||
 |
%
responses 2009 ('05) |
|||||||||||||||
y4 |
y8 |
|||||||||||||||
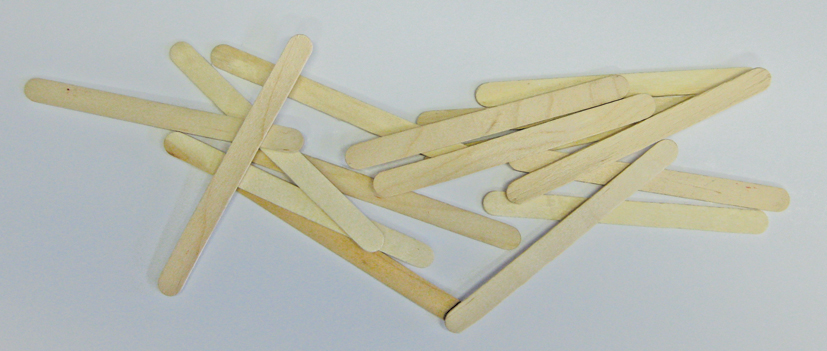
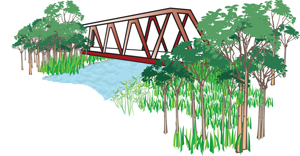
| 1. Use the sticks to make 5 sections of a bridge. Draw it here. | 5 sections shown | 78 (71) | ||||||||||||||
| some sections shown | 9 (11) | |||||||||||||||
| 2. How many sticks would you need to make 11 sections of a bridge? | 23 | 35 (45) | ||||||||||||||
| 3. How did you work that out? | ||||||||||||||||
| clear description of general strategy | 36 (30) | |||||||||||||||
| vague description of general strategy | 21 (24) | |||||||||||||||
| drew the picture and counted | 20 (22) | |||||||||||||||
| 4. How many sticks would you need to make 100 sections of a bridge? | 201 | 12 (16) | ||||||||||||||
| 5 How did you work that out? | ||||||||||||||||
| clear description using equation | 21 (17) | |||||||||||||||
| clear description using words | 13 (16) | |||||||||||||||
| vague description of appropriate strategy | 18 (20) | |||||||||||||||
Total
score: |
9–10 |
9 (11) | ||||||||||||||
| 7–8
|
18 (14) | |||||||||||||||
| 5–6
|
27 (28) | |||||||||||||||
| 3–4
|
24 (22) | |||||||||||||||
| 0–2 | 22
(25) |
|||||||||||||||
| Subgroup Analysis [Click on charts to enlarge] : |
| Commentary: |
| Performance
on this task was very similar in 2005 and 2009. Girls scored significantly
higher than boys. Differences between Pakeha, Mäori and Pasifika
students were quite small, on average, although few Pasifika students
scored highly. |


