|
||||||||||||||||
|
||||||||||||||||
 |
%
responses 2009 ('05) |
|||||||||||||||
y4 |
y8 |
|||||||||||||||
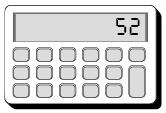
| 26 ÷ 5 = | 5.2 | 89 (85) | ||||||||||||||
 |
||||||||||||||||
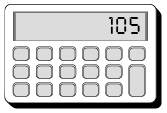
| 1.5 × 7 = | 10.5 | 78 (74) | ||||||||||||||
 |
||||||||||||||||
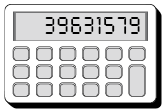
| 753 ÷ 19 = | 39.631579 | 39 (37) | ||||||||||||||
 |
||||||||||||||||
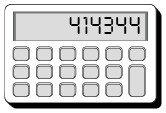
| 211.4 × 196 = | 41434.4 | 30 (30) | ||||||||||||||
| |
||||||||||||||||
Total
score: |
4
|
17 (18) | ||||||||||||||
| 3 |
28 (23) | |||||||||||||||
| 2
|
36 (35) | |||||||||||||||
| 1
|
12 (15) | |||||||||||||||
| 0 | 7
(9) |
|||||||||||||||
| Subgroup Analysis [Click on charts to enlarge] : |
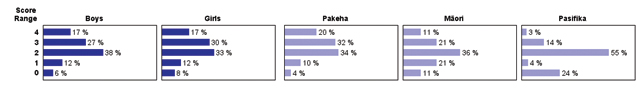
| Commentary: |
| Overall,
performance is very similar in 2005 and 2009. On average, Pasifika
students scored substantially lower than Pakeha students. Estimation
skills for computations involving larger numbers appear to be weak. |