|
||||||||||||||||
|
||||||||||||||||
%
responses 2009 ('05) |
||||||||||||||||
y4 |
y8 |
|||||||||||||||
| Tick the best answer. |
|
30 (33) | 66 (74) | |||||||||||||
| Booklet B | 33 (29) | 16 (13) | ||||||||||||||
| Booklet C | 33 (37) | 14 (8) | ||||||||||||||
| |
||||||||||||||||
Total
score: |
2
|
30 (33) | 66 (74) | |||||||||||||
| 1
|
33 (37) | 14 (8) | ||||||||||||||
| 0 | 37 (30) | 20 (18) | ||||||||||||||
| Subgroup Analysis [Click on charts to enlarge] : |
Year 4  |
||

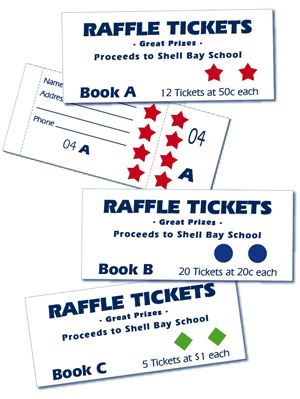
| Commentary: |
Solving
this task involved multiplication or repeated addition of individual
ticket costs for each booklet of tickets. Because almost equal percentages
of year 4 students chose each option, there is very little evidence
of this capability for year 4 students. Performance at both year
levels was a little lower in 2009 than in 2005. At both year levels,
Mäori students performed similarly to
Pakeha students. |