|
||||||||||||||||||
|
||||||||||||||||||
%
responses 2009 ('05) |
||||||||||||||||||
y4 |
y8 |
|||||||||||||||||
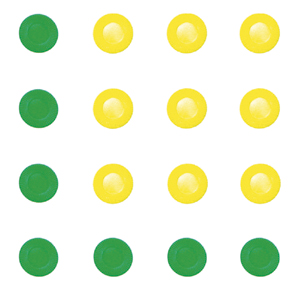
| 1. Use the green and yellow pencils to draw the next pattern – pattern number 3. | ||||||||||||||||||
 |
pattern drawn appropriately | 25 (31) | 53 (71) | |||||||||||||||
| YEAR 8 ONLY: | ||||||||||||||||||
| 2. This table shows the pattern in numbers. Finish the table by filling in the missing numbers. | ||||||||||||||||||
| Pattern | Green | Yellow | ||||||||||||||||
| 1 | 3 | 1 | ||||||||||||||||
| 2 | 5 | 4 | ||||||||||||||||
| 3 | 7 | 9 | both
correct one correct |
43
(47) 36 (36) |
||||||||||||||
| 4 | 9 | 16 | both
correct one correct |
29
(30) 46 (48) |
||||||||||||||
| 5 | 11 | 25 | both
correct one correct |
23
(27) 50 (48) |
||||||||||||||
| 100 | 201 | 10 000 | both
correct one correct |
3
(5) 5 (7) |
||||||||||||||
|
||||||||||||||||||
Total
score: |
8–9 |
5 (9) | ||||||||||||||||
| 6–7
|
21 (23) | |||||||||||||||||
| 4–5
|
32 (33) | |||||||||||||||||
| 2–3
|
20 (16) | |||||||||||||||||
| 0–1 | 22
(19) |
|||||||||||||||||
| Subgroup Analysis [Click on charts to enlarge] : |
| Commentary: |
| This
task involved recognition and extrapolation of patterns. Very few year
8 students managed the final step of generalising the pattern to the
100th step. Performance dropped a little for both year 4 and year 8
students between 2005 and 2009. At year 8 level, Pasifika students
were much less successful, on average, than Pakeha students. |


