|
||||||||||||||||
|
||||||||||||||||
%
responses 2009 ('05) |
||||||||||||||||
y4 |
y8 |
|||||||||||||||
| 1. What do you think Matt should do to get some data or information to go with his letter? | ||||||||||||||||
| Data on frequency of jelly beans in packets: | ||||||||||||||||
| use several packets of jelly beans to tally/graph proportion of black ones | 35 (35) | |||||||||||||||
| use single packet of jelly beans to tally/graph proportion of black ones | 24 (31) | |||||||||||||||
| Data on proportion of people who particularly like black jelly beans: | ||||||||||||||||
| presented good ideas for a survey | 13 (10) | |||||||||||||||
| mentioned issue without elaboration | 11 (10) | |||||||||||||||
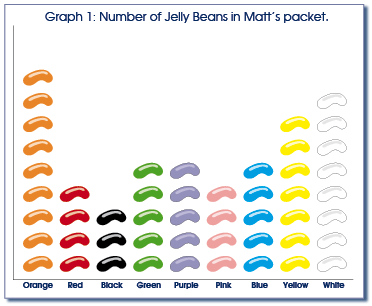
| Show student graph 1. | ||||||||||||||||
 |
||||||||||||||||
| This graph shows the jelly beans in one packet. | ||||||||||||||||
| 2. Do you think that this would be enough information to convince the makers that there should be more black jelly beans in each packet? | ||||||||||||||||
| 48 (54) | ||||||||||||||||
| yes | 48 (39) | |||||||||||||||
| 3. Why do you think that? | ||||||||||||||||
| Support for “yes”: | black lowest on graph | 36 (32) | ||||||||||||||
| Support for “no”: | only one fewer black than red or pink | 10 (9) | ||||||||||||||
| should sample more than one packet to judge proportion of black | 27 (34) | |||||||||||||||
| graph does not give information about people’s preference for different colours | 7 (10) | |||||||||||||||
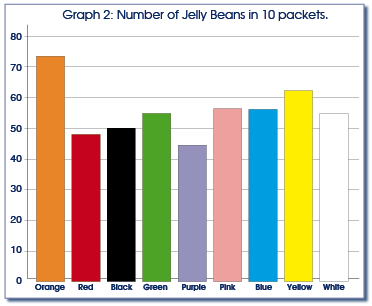
| Show student graph 2. | ||||||||||||||||
 |
||||||||||||||||
| This graph shows the jelly beans in ten packets. | ||||||||||||||||
| 4. Do you think that Matt should write to the jelly bean makers? | 71 (68) | |||||||||||||||
| yes | 24 (23) | |||||||||||||||
| 5. Why do you say that? | ||||||||||||||||
| Support for “no”: | black is not lowest on graph | 61 (59) | ||||||||||||||
| Support for “yes”: | black is not high/highest on graph | 7 (4) | ||||||||||||||
| lots of people have black as their favourite | 2 (2) | |||||||||||||||
Total
score: |
6–7 |
15 (10) | ||||||||||||||
| 4–5
|
28 (34) | |||||||||||||||
| 2–3
|
37 (43) | |||||||||||||||
| 0–1 | 20
(13) |
|||||||||||||||
| Subgroup Analysis [Click on charts to enlarge] : |
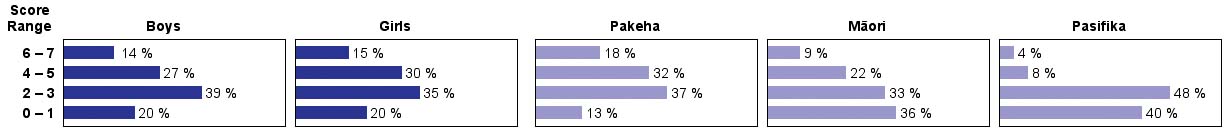
| Commentary: |
| This
task involved interpreting data, taking into account randomness and
probability. Performance was not strong, with 57% scoring fewer than
half marks. Pasifika students scored markedly lower than Pakeha and Mäori
students. |