|
|||||||||||||||
|
|||||||||||||||
%
responses 2009 ('05) |
|||||||||||||||
y4 |
y8 |
||||||||||||||
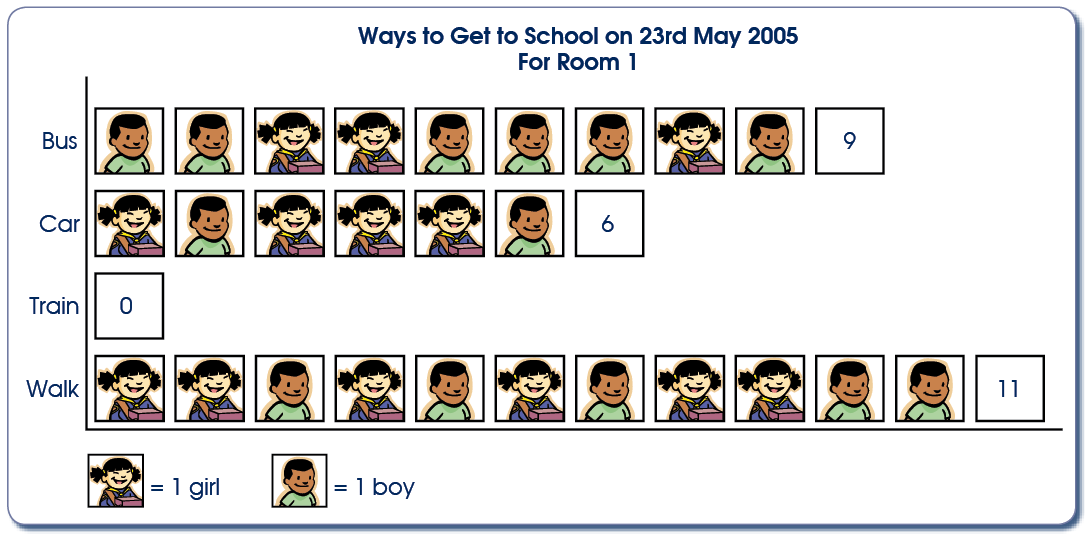
| 1. How many children walk to school? | 11 | 93 (88) | 99 (99) | ||||||||||||
| 2. How many more children come by bus than by car? | 3 | 62 (62) | 89 (91) | ||||||||||||
| 3.
This graph is for the 23rd of May. Would the graph look the same every day? |
no | 90 (89) | 95 (92) | ||||||||||||
| 4. Why do you think that? | |||||||||||||||
| Explanation: | understanding
of variation (e.g. some children might stay home because sick; some children might want to be driven if it is raining) |
51 (49) | 79 (72) | ||||||||||||
| some understanding of variation but unclear | 26 (31) | 15 (20) | |||||||||||||
| 5. What does the row with ‘Train’ tell you about how these children go to school? | |||||||||||||||
| nobody took the train that day | 5 (3) | 6 (5) | |||||||||||||
| nobody catches/uses the train | 46 (62) | 59 (64) | |||||||||||||
| no trains in area/train doesn’t stop there/train too expensive, etc. | 17 (16) | 23 (19) | |||||||||||||
| 6. Tom was not at school on that day. How do you think he normally gets to school? | |||||||||||||||
| no way to tell/can’t know | 2 (1) | 11 (12) | |||||||||||||
| walk | 26 (25) | 32 (31) | |||||||||||||
| bus | 21 (19) | 17 (16) | |||||||||||||
| car | 27 (40) | 17 (19) | |||||||||||||
| train | 16 (8) | 15 (11) | |||||||||||||
| any other response (incl. “don’t know”) | 8 (7) | 8 (11) | |||||||||||||
| 7. Why do you think that? | |||||||||||||||
| Explanation: | sound explanation for “not able to tell” | 1 (1) | 7 (9) | ||||||||||||
| reasonable argument for specific choice based on graph | 27 (17) | 46 (41) | |||||||||||||
| |
|||||||||||||||
Total
score: |
6–7
|
14 (10) | 41 (34) | ||||||||||||
| 5
|
30 (28) | 39 (40) | |||||||||||||
| 4
|
24 (26) | 13 (20) | |||||||||||||
| 3
|
14 (18) | 4 (3) | |||||||||||||
| 0–2 | 18 (18) | 3
(3) |
|||||||||||||
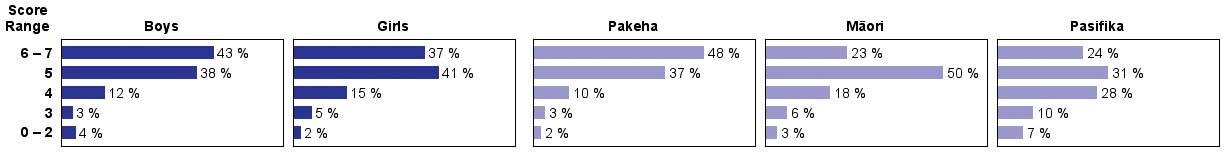
| Subgroup Analysis [Click on charts to enlarge] : |
Year 4 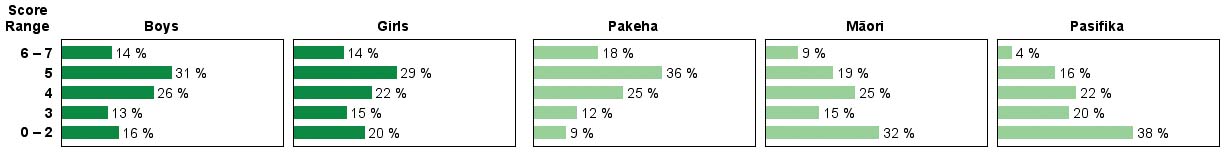 |
||
Year
8 |
| Commentary: |
| Most
students were good at direct interpretation of the graph for the day,
but far fewer understood day-to-day variability in travel methods.
There was no meaningful change in performance from 2005 to 2009. Year
4 Mäori and Pasifika students and year 8 Pasifika students scored
substantially lower than their Pakeha counterparts. |