|
||||||||||||||||
|
||||||||||||||||
%
responses 2008 ('04) |
||||||||||||||||
y4 |
y8 |
|||||||||||||||
|
79 (75) | 95 (97) | ||||||||||||||
|
79 (80) | 90 (95) | ||||||||||||||
|
61 (60) | 72 (82) | ||||||||||||||
|
71 (64) | 84 (86) | ||||||||||||||
|
70 (63) | 78 (82) | ||||||||||||||
|
26 (27) | 29 (30) | ||||||||||||||
| |
||||||||||||||||
Total
score: |
6 | 7 (9) | 18 (19) | |||||||||||||
| 5 | 28 (24) | 37 (43) | ||||||||||||||
| 4 | 29 (27) | 29 (25) | ||||||||||||||
| 3 | 23 (21) | 10 (9) | ||||||||||||||
| 0–2 | 13 (19) | 6
(4) |
||||||||||||||
| Subgroup Analysis [Click on charts to enlarge] : |
| Commentary: |
| This
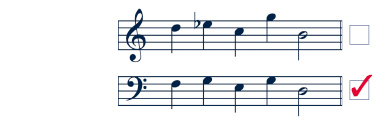
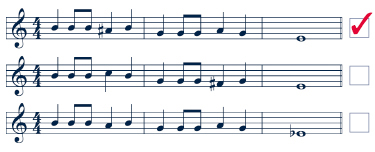
task was previously used in 1996. Performance in 2008 was similar
to performance in 1996: slightly higher for year 4 students, slightly
lower for year 8 students. Most students found the final example
very hard, but otherwise enjoyed quite good success. |

