The graphs and figures
that illustrate the derivation of a hierarchical cluster profile based
on the Nine Nemp A Sample Tasks follow. [4]
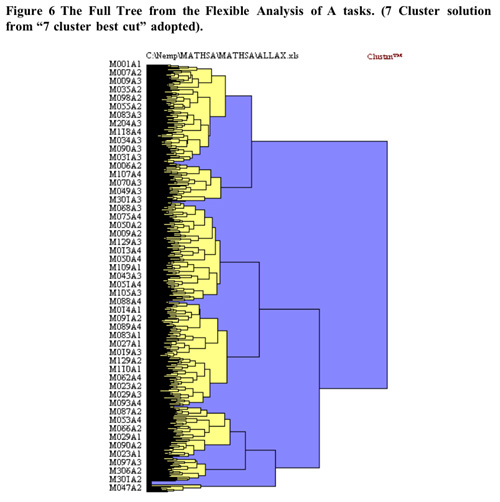
The initial cluster solution is illustrated below in Figure 6 shaded at
the 7 cluster solution.
[4] Note that in the following analysis – the collections of math facts and algorithm tasks were removed as independent validation aids (and because they threatened to produce a over-weighting of this particular “school mathematics” in the analysis).
The heirarchical cluster solution was based upon the flexible cluster procedure with beta set to .25. No cases were removed from the analysis but they appeared in the binary variable set for the analysis with zero scores for all responses. The scree slope of the pseudo t statistic which led to the decision to utilise the seven cluster solution is illustrated in Figure 7 below. The flattening out of the pseudo-t line past the 7 cluster point may be because the amalgamations between clusters past that point do not represent joinings between profoundly different clusters.
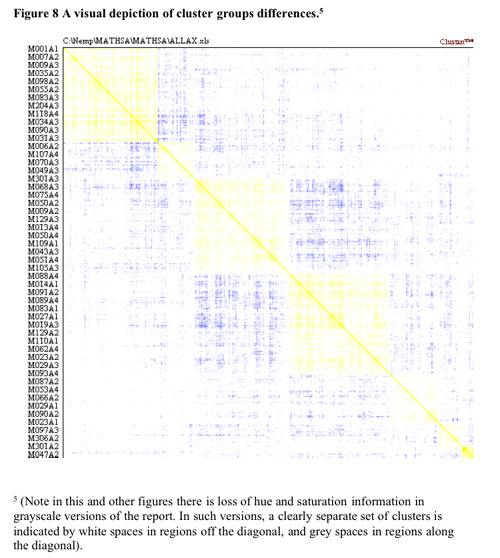
Some support for the seven cluster solution is found in the visual depiction of cluster solutions in Figure 8 below. While the colour density indicates quite a dispersed set of objects (students), it can be seen that in general there tends to be a slightly higher colour density within clusters than between clusters.
The structure evident in the truncated tree in Figure 9 emphasizes the
difference between this cluster and the other four.
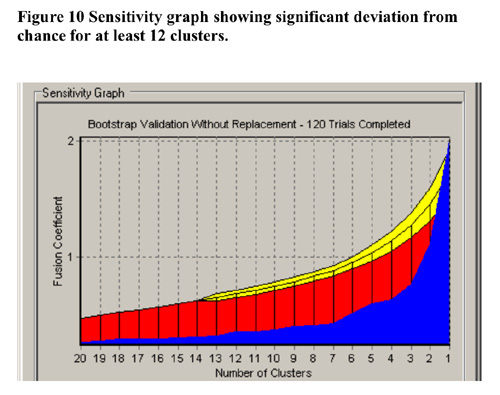
In terms of validation of the non-randomness of the cluster solution at 7 clusters, CLUSTAN GRAPHICS allowed the comparison of the series of fusion coefficients (distances) of the actual sample compared to a series of Bootstrap-derived samples. The results of this comparison is detailed in Figure 10 below. The largest deviations of the Bootstrap derived samples from the other samples between 3 and 7 clusters. . Based upon these results, the decision to utilise the 7 cluster solution in further analysis has justification.
Analyses to Validate and Explore the Emergent Clusters.
![]() To validate the emergent clusters we carried out Analysis of Variance
to ascertain if there were significant differences between the groups
in terms of the overall scores. Because of time limitations the raw
output from these analyses have been provided below. It can be seen
that Cluster 1 scores significantly higher than all other clusters.
Clusters 2,3,4 are not significantly different from each other, but
they score significantly higher than Clusters 5 and 6. Cluster 5 scores
significantly worse than Cluster 6.
To validate the emergent clusters we carried out Analysis of Variance
to ascertain if there were significant differences between the groups
in terms of the overall scores. Because of time limitations the raw
output from these analyses have been provided below. It can be seen
that Cluster 1 scores significantly higher than all other clusters.
Clusters 2,3,4 are not significantly different from each other, but
they score significantly higher than Clusters 5 and 6. Cluster 5 scores
significantly worse than Cluster 6.
Oneway Analysis of Variance of the total scores on the nine Nemp task items.
The analysis above
reveals that there are significant differences in performance on the
NEMP tasks between the clusters. cluster group 1 has by far the best
performance on the tasks, cluster groups. On the other hand, cluster
groups 2,3,4 are very close in total score and the question arises of
whether in spite of this similarity in total score a different profile.
In order to look at the differences between profiles tables of the most
common response to each task were prepared. These are shown in Table
4 below.
Table 4 Modal responses on the tasks for each cluster group.
CLUSTER
CATEGORY (final) |
|||||||
CLUSTER 1 |
CLUSTER 2 |
CLUSTER 3 |
CLUSTER 4 |
CLUSTER 5 |
CLUSTER 6 |
CLUSTER 7 |
|
MODE |
MODE |
MODE |
MODE |
MODE |
MODE |
MODE |
|
| Smallest note for 5 kilo apples @ $1.95/kilo | 2 |
2 |
2 |
2 |
1 |
2 |
• |
| Why did you choose note? | 1 |
2 |
2 |
2 |
0 |
2 |
• |
| How much change would you expect? | 1 |
0 |
0 |
0 |
0 |
0 |
• |
| 5 Kilo of Apples for $7.50 what per kilo? | 1 |
1 |
1 |
0 |
0 |
0 |
• |
| Biggest number from 3 5 8 1 | 1 |
1 |
1 |
1 |
1 |
1 |
1 |
| Reading of the biggest number | 3 |
3 |
3 |
3 |
3 |
1 |
• |
| Smallest number from 3 5 8 1 | 1 |
1 |
1 |
1 |
1 |
1 |
1 |
| Reading of the smallest number | 3 |
3 |
3 |
3 |
3 |
1 |
• |
| Biggest number with one after decimal point | 2 |
2 |
2 |
2 |
2 |
2 |
2 |
| Reading of the biggest decimal number | 3 |
3 |
3 |
3 |
3 |
1 |
• |
| Smallest number with two after the decimal point. | 2 |
2 |
2 |
2 |
2 |
2 |
2 |
| Reading of the smallest decimal number | 3 |
3 |
3 |
3 |
3 |
1 |
• |
| Estimate of bolt length | 2 |
0 |
1 |
2 |
0 |
2 |
2 |
| Actual bolt length | 2 |
2 |
2 |
2 |
2 |
2 |
2 |
| Estimate of pencil length | 2 |
1 |
1 |
2 |
0 |
1 |
2 |
| Actual pencil length | 2 |
2 |
2 |
2 |
2 |
2 |
2 |
| Estimate of stick length | 2 |
2 |
2 |
2 |
0 |
2 |
2 |
| Actual stick length | 2 |
2 |
2 |
2 |
2 |
2 |
2 |
| Estimate of ribbon length | 2 |
2 |
2 |
2 |
0 |
2 |
2 |
| Actual ribbon length | 2 |
2 |
2 |
2 |
2 |
2 |
2 |
| Estimate of height | 2 |
2 |
2 |
2 |
0 |
2 |
2 |
| Actual measure of height | 2 |
2 |
2 |
2 |
0 |
2 |
2 |
| How many cars go down in 9 minutes (98=10) | 0 |
0 |
0 |
0 |
0 |
0 |
0 |
| How did you get that number of cars? | 6 |
6 |
6 |
6 |
0 |
0 |
• |
| Mark .1 | 1 |
1 |
0 |
0 |
0 |
0 |
0 |
| Mark 1/10 | 1 |
1 |
0 |
0 |
0 |
0 |
0 |
| Mark .25 | 1 |
0 |
0 |
0 |
0 |
0 |
0 |
| Mark .5 | 1 |
1 |
0 |
0 |
0 |
0 |
0 |
| Mark 50% | 1 |
1 |
1 |
0 |
0 |
0 |
0 |
| Mark .7 | 1 |
1 |
0 |
0 |
0 |
0 |
0 |
| Mark 4/5 | 1 |
0 |
0 |
0 |
0 |
0 |
0 |
| Mark 100% | 1 |
1 |
1 |
0 |
0 |
1 |
0 |
| Most likely colour? | 3 |
3 |
3 |
3 |
3 |
3 |
• |
| Why do you say that is the most likely colour? | 1 |
1 |
1 |
1 |
1 |
1 |
• |
| What is the chance of taking a yellow teddy? | 5 |
0 |
0 |
0 |
0 |
0 |
• |
| What is the chance of taking a green teddy? | 5 |
0 |
0 |
0 |
0 |
0 |
• |
| How many Wallies in the picture? (Estimation) | 2 |
2 |
2 |
2 |
2 |
2 |
2 |
| wally 2 = Wall1+1 | 4 |
6 |
2 |
2 |
2 |
4 |
2 |
| 36+29= (First way) | 1 |
0 |
1 |
0 |
0 |
0 |
• |
| 36+29= (Second way) | 0 |
0 |
0 |
0 |
0 |
0 |
• |
| 36+29= (Third way) | 0 |
0 |
0 |
0 |
0 |
0 |
• |
| 35-19=(strategy) | 1 |
0 |
0 |
0 |
0 |
0 |
• |
| 35-19= (worked through)? | 0 |
0 |
0 |
0 |
0 |
0 |
• |
| 35-19= (container strategies) | 3 |
3 |
3 |
3 |
3 |
3 |
• |
| 35-19= (worked through with containers)? | 0 |
0 |
0 |
0 |
2 |
2 |
• |
Qualitative
Summary of cluster groups
![]() As well as the quantitative
analysis of scores and examination of modal responses, a cross-tabulation
of each task used in the analysis by the cluster groups was carried
out. The tables from these are found in Appendix II. For most tasks
there was a significant chi-square statistic indicating non chance differences
in the distributions of task responses between groups. A qualitative
summary of the cluster group profiles obtained by the cross tabulation
of NEMP task by cluster group follows.
As well as the quantitative
analysis of scores and examination of modal responses, a cross-tabulation
of each task used in the analysis by the cluster groups was carried
out. The tables from these are found in Appendix II. For most tasks
there was a significant chi-square statistic indicating non chance differences
in the distributions of task responses between groups. A qualitative
summary of the cluster group profiles obtained by the cross tabulation
of NEMP task by cluster group follows.
Cluster group 1 showed a good grip on all tasks:
-
High competency in everyday money ratio task. (Based for many on computation strategy)
-
Very high competence on digit task testing knowledge of place value. On whole numbers it was virtually maximal. There was a slight drop off in dealing with decimals and for about 20% some difficulty in obtaining the lowest valued decimal digit to two significant figures.
-
Estimation of the lengths of objects was the best of all the groups (around 50% on whole). Their competency at measurement was good (best of all groups).
-
The group was the only group in the moptorway task to show a preference for estimation over algorithm.
-
This group was competent at marking the 0-1 number line for all items (only group that this was so for).
-
Showed greatest statistical knowledge of all groups (both at the relative probabilities and the computational level).
-
It was the only group to have a sizeable portion of responses correct in estimation of Wallies (suggesting a working estimation strategy).
-
Was the greatest identifier of a conventional algorithm or first tens then units approach on strategies for two digit addend addition.
-
Was the most likely to use non-algorithmic sophisticated compensations in subtraction.
We label this group as the mathematically and strategically competent cluster group.
Cluster group 2 had lower levels of performance on a number of tasks than cluster group 1.
-
High competency in everyday money ratio task. Used estimation as preferred strategy in deciding change and so was correct on 25% of time. Half were correct in ascertaining the cost per kilo.
-
High competence on digit task testing knowledge of place value. There was a slight drop off in dealing with decimals. Only about 50% could give a place-valued read-back when decimals were involved.
-
Estimation of the lengths of objects was moderately accurate. Their competency at measurement was good (except for height).
-
Low level of accuracy at the motorway task favouring the use of algorithms in solution attempts.
This group had difficulty in marking decimals and fractions on the 0-1 number line except for 1/10. -
On the statistical task showed competence at relative probabilities only.
-
On the Wallies task showed the pattern typical of most groups of a slight underestimation (but some in the group were also inclined to a large over-estimation).
-
Was the group most likely to not identify a way of addition.
-
Was the least likely to identify a strategy in the subtraction. However when using concrete objects were least likely to use a mixed strategies of counting and removing a partition of the collection. (More likely than other groups to use the strategy of count to the initial amount and then counting out the second amount.)
Because of their primitive strategies and their lack of certainty about ratios and number placements, we label this group as the primitive computational strategies cluster group.
Cluster group 3 had lower levels of performance on a number of tasks than cluster group 1.
-
High competency in everyday money ratio task. Used estimation as preferred strategy in deciding change and so was correct on 25% of time. Half were correct in ascertaining the cost per kilo.
-
High competence on digit task testing knowledge of place value. There was a slight drop off in dealing with decimals. There was a considerable drop off compared with Cluster 1 and Cluster 2 in dealing with the problem of obtaining the lowest valued decimal digit to two significant figures. Only about 50% could give a place-valued read-back when decimals were involved
-
Estimation of the lengths of objects was less accurate than that for Clusters 1, 2,4. Their competency at measurement was good (especially for height)
-
Low level of accuracy at the motorway task favouring the use of algorithms in solution attempts.
-
This group had profound difficulty difficulty in marking the number line except for the 50% and 100% questions.
-
On the statistical task showed second highest competence, They succeeded at the level of relative probabilities about a quarter of this group could calculate chance of drawing particular classes.
-
On the Wallies task showed the pattern typical of most groups of a slight underestimation (but some in the group were also inclined to a large over-estimation).
-
Was most likely to use a conventional algorithm or first tens then units approach as strategies for two digit addend addition.
-
Was the least inclined to work through their identified strategy in subtraction. However when using concrete objects were likely to use a mixed strategy of removing a partition of the initial amount, and then counting out the amount being subtracted.
Because of their of uncertainty about number placements on the 0-1 line, but their quite good problem-solving we label this group the developing conceptual strategies cluster group.
Cluster group 4 had lower levels of performance on a number of tasks than cluster group 1.
- High competency in everyday money ratio task. Used estimation as preferred strategy in deciding change and so was correct on 25% of time. Half were correct in ascertaining the cost per kilo.
- High competence on digit task testing knowledge of place value. There was a slight drop off in dealing with two place decimals.
- Estimation of the lengths of objects was moderately accurate. Their competency at measurement was good (except for height).
- Low level of accuracy at the motorway task favouring the use of algorithms in solution attempts.
- This group had difficulty in marking the 0-1 number line for all stipulated points.
- On statistical task showed competence at relative probabilities and about 20% of this group could estimate chances.
- On the Wallies task showed the pattern typical of most groups of a slight underestimation (but some in the group were also inclined to a n over-estimation).
- Was likely to not identify a way of addition.
- Was not likely to identify a strategy in the subtraction. They were the group who mentioned concrete materials most. However when using concrete objects were least likely to use the objects. Their preference was for removing a partition of the initial amount, and then counting out the amount being subtracted.
Because of their primitive strategies, their lack of certainty about ratios and number placements, and their preference for concrete objects we label this group as the concrete object strategies cluster group.
Cluster group 5 had lower levels of performance on a number of tasks than all other cluster groups (Cluster group 7 not considered as it contained such a high proportion of missing data.)
-
Low competency in everyday money task.
-
Reasonably competent on ordering whole number digits. The performance on all tasks was poor especially interpreting decimal place values..
-
Estimation of the lengths of objects was poor. Was the only group showing a profound lack of competency at measurement of actual lengths.
-
Very low level of accuracy at the motorway task favouring the use of algorithms in solution attempts.
-
This group had difficulty in marking the 0-1 number line for all stipulated points.
-
On statistical task showed some competence at relative probabilities only.
-
On the Wallies task showed the pattern typical of most groups of a slight underestimation (but some in the group were also inclined to an over-estimation).
-
Wasnot likely to not identify a strategy for addition.
-
Was not likely to identify a strategy in the subtraction. When a strategy was mentioned the conventional algorithm or counting up was preferred.
Because of their multitude of difficulties this group as the mathematics uncertain cluster group.
Cluster group 6 had lower levels of performance on most of tasks than all other cluster groups except for cluster group 5. (Cluster group 7 not considered as it contained such a high proportion of missing data.)
-
High competency in everyday money ratio task. Used estimation as preferred strategy in deciding change and so was correct on 20% of time. Less than a third were correct in ascertaining the cost per kilo.
-
Reasonably competent on ordering number digits to obtain largest or smallest quantities. The performance on all tasks involving read back multidigit numbers was poor including interpreting decimal place values..
-
Estimation of the lengths of objects was moderate. Their competency at measurement was good (but less so for height).
-
Very low level of accuracy at the motorway task favouring the use of algorithms in solution attempts (if a strategy afforded).
-
This group had difficulty in marking the 0-1 number line for all stipulated points except for 100%.
-
On statistical task showed some competence at relative probabilities only.
-
On the Wallies task showed the pattern typical of most groups of a slight underestimation (but some in the group were also inclined to an over-estimation).
-
Was most likely to not identify a strategy the conventional algorithm or first units then tens when adding.
-
Was not likely to identify a strategy in the subtraction. When a strategy was mentioned the conventional algorithm or counting up was preferred. Using concrete objects like Group 2 they had a lower likelihood of using a mixed strategy of counting and removing a partition of the collection. They would also use the strategy of counting to the initial amount and then counting out the second amount.
Because of their difficulties in number naming and place value this group is labeled as the number conventions uncertain cluster group.
Cluster
group 7
The number in this group, and the amount of missing data it generated
means that any consideration of its results would be misleading.
Demographic
Results
The differences in the distributions between Clusters on the external
Demographic variables provides some validating evidence. The differentiating
patterns evident in the Demographic results in the Appendix IV can be
stated as:
-
Students from low SES decile schools were proportionately less likely than students from high SES decile schools to be found in the best performing Cluster 1 and more likely to be in the less well performing Clusters 5 and 6.
-
Mäori students were proportionately less likely than European students to be found in the best performing Cluster 1 and more likely to be in the less well performing Clusters 5 and 6.
-
Students from larger schools (schools in larger centers) were proportionately more likely than students from smaller schools to be located in the best performing Cluster 1 and less likely to be in the less well performing Clusters 5 and 6.
-
Students from intermediate schools were proportionately more likely than students from full primary schools to be located in the best performing Cluster 1 and less likely to be in the less well performing Clusters 5 and 6.
Questionnaire
Results
There were also differences between Clusters on the responses to questions
asked in the NEMP survey (see Appendix III).
-
What maths activities do you like at school? Compared to other groups, Clusters 5 and 6 having difficulty with mathematics were far more inclined to say that they enjoyed working in their textbook or doing worksheets than the other groups.
-
What maths activities do you like at school? Compared to other groups, Clusters 5 and 6 were likely to place less importance on knowing mathematics facts and more importance on developing good classroom behaviours.
-
What are the interesting maths you do in own time? Compared to other groups, Clusters 5 and 6 were likely to mention basic facts and tables and they were less likely to mention solving problems or life skills mathematics.
-
What do you do with really hard things? Compared to other groups, Clusters 5 and 6 were far more likely to ask a teacher and less likely to persevere. Those students in the best performing Cluster 1 were most likely to indicate that they would persevere.
Global summary
The results indicated distinct cluster groups with different profiles
of competencies and difficulties. This is well illustrated by the responses
to the 0-1 number line placement task in which each group had a different
pattern of differences (this task is analysed separately in the next
section of the report). Perhaps the most important thing to note from
the cluster analysis of the tasks is the evidence for the existence
of two clusters with profound mathematical difficulties. These two clusters
comprised 18% of the total eligible sample.
There are strong indications that demographic factors and metacognitive
understanding of mathematics learning play a role in which cluster a
student is likely to be found in. It is disturbing that the strategy
of "ask the teacher" is the strategy of first resort for students
in poorly performing cluster groups. It is even more disturbing that
51% of students in decile 1 schools are located in the poorly performing
cluster groups (in contrast only 5% of students in decile 10 schools
are located in the poorly performing cluster groups.