The graphs and figures that illustrate the derivation of a hierarchical cluster profile based on the one cut C Sample task follow.
The initial cluster
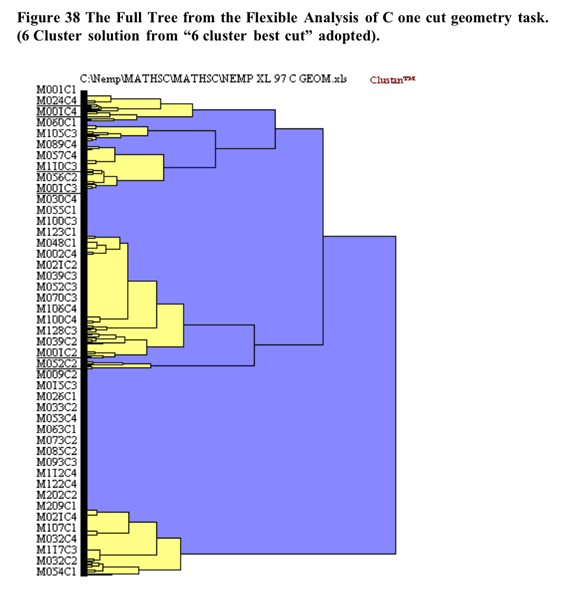
solution is illustrated below in Figure 38 shaded at the 6 cluster solution.

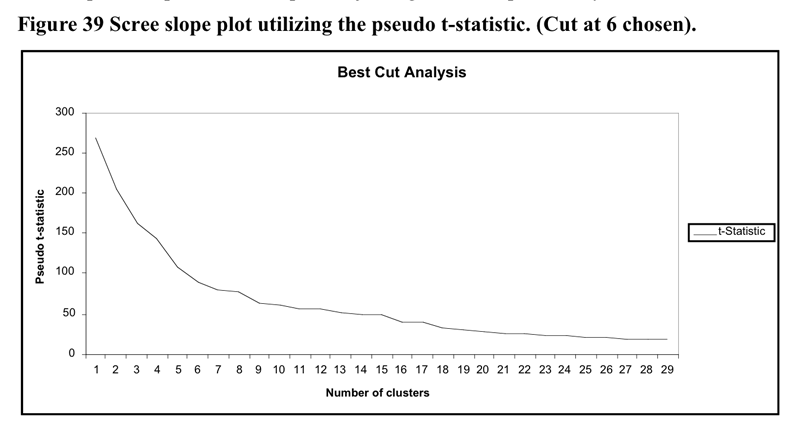
The heirarchical cluster solution was based upon the flexible cluster procedure with beta set to -.25. There were 20 cases removed from the analysis as they became irreconcilable single case clusters made up of missing data:. The scree slope of the pseudo t statistic which partially led to the decision to utilise the six cluster solution is illustrated Figure 39 below (another factor was to reduce the number of minor clusters). The flattening out of the pseudo-t line past the 9 cluster point may be because the amalgamations between clusters past that point do not represent joinings between profoundly different clusters.
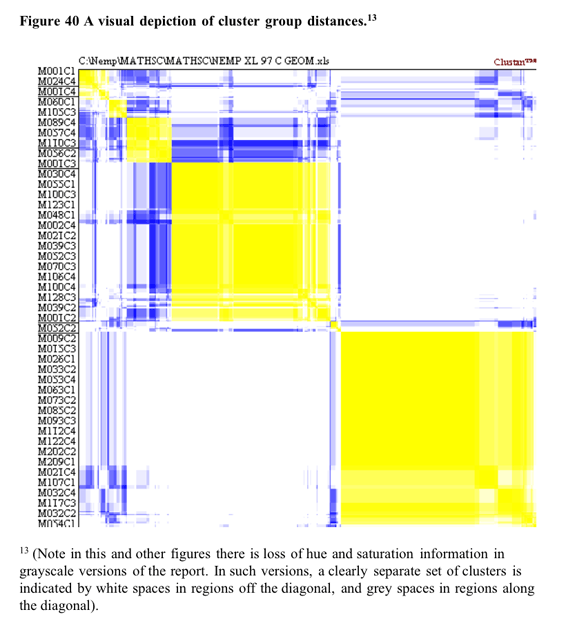
Some support for the six cluster solution is found in the visual depiction of cluster solutions in Figure 40 below. Coloured versions of the figure showed that there was a higher colour density within clusters than between clusters (with the possible exception of cluster 1). [12] The relatively large separating differences of the upper shaded branches branches of the dendogram in Figure 38 (assessed from the distance moved along the horizontal axis) also suggests distinct clusters.
[12] Note that low proximities between clusters are necessary but not sufficient conditions for “real” clusters. To be regarded as such, there must also be close proximities within clusters.
In terms of validation of the non-randomness of the cluster solution at 6 clusters, CLUSTAN GRAPHICS allowed the comparison of the series of fusion coefficients (distances) of the actual sample compared to a series of Bootstrap-derived samples. The results of this comparison is detailed in Figure 41 below. The largest deviations of the Bootstrap derived samples from the actual sample occurs between 2 and 4 clusters. Based upon these results, the decision to utilise the 6 cluster solution in further analysis has justification.
Qualitative
Summary of cluster groups![]() Cross
tabulation of each task by the six cluster groups was carried out. Table
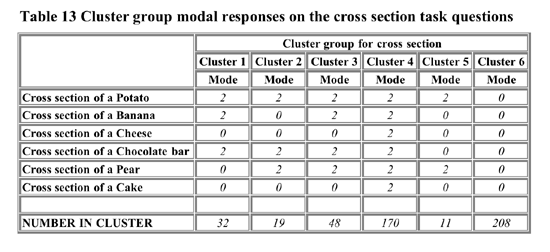
13 shows the modal responses of the cluster groups on the task questions.
Cross
tabulation of each task by the six cluster groups was carried out. Table
13 shows the modal responses of the cluster groups on the task questions.
The cluster groups 1,2,3 are similar except that cluster group 1 shows an idiosyncratic difficulty with the cross-section of a pear, and cluster group 2 shows an idiosyncratic difficulty with the cross-section of a banana. Cluster group 4 is successful at all task questions, and cluster group 6 (the largest cluster group) is successful at none. Cluster group 5 is small and successful with cross-sections of potatos and pears.
The
crosstabulation summary is to be found in Appendix XIV. A qualitative
summary of the main cluster group profiles obtained by the cross tabulation
of each Nemp task question by cluster groups follows:
Cluster group 1 (comprised of Clusters 1,2,3) appear to be successful
at simple cross-sections where the cross-section is of a familiar object
with the cut along an unambiguous plane of division into equal parts.
We might label this group the familiar object one orientation-divide
cluster group.
Cluster group 2 (comprised of cluster 4) showed good performance
on all the task questions. We might label this group competent 2-D
section from 3-D object cluster group.
Cluster group 3 (comprised of cluster 6) showed poor performance
on all cross-section task questions. We might label this group the unable
to 2-D section from 3-D object cluster group.
Global
summary
The three cluster groups identified differ profoundly. The very competent
cluster group comprised 35% of the sample there were another 20% with
definite signs of development of skills in the geometry of cross-sections.
Contrastingly 43% of students had difficulty with providing cross-sections
of all objects. The question this raises is whether the difficulties
of this group relate to lack of curriculum experiences (Level 2 provides
these learning experiences), or to issues of cognitive capacities for
the mental operations in these tasks (c.f. Case, 1985). Further research
into these results is called for.


