INTRODUCTION
The discussion of the previous sections has identified several areas that
would appear to provide a useful focus for the active teaching of investigative
skills at the primary school level. However, many of the epistemological
ideas raised by the framework presented in Section Five cannot be easily
translated into actual teaching strategies in the absence of a well-developed
personal understanding of the distinguishing characteristics of scientific
inquiry. Some of the literature reviewed in Section Four contributes to
a wider body of research which demonstrates that “lay” adults
do not necessarily demonstrate such understandings when confronted with
the challenge of producing a scientific investigation (Schauble, 1996;
Zohar, 1995). The research that prompted the design of this project (Gilmore,
2001) showed that New Zealand primary school teachers may not easily articulate
ideas for actively teaching these types of understandings. Nevertheless,
it is unhelpful to paint all (or indeed any) primary school teachers into
a “deficit” corner. To support those primary teachers who
have not yet had opportunities to develop such thinking themselves, the
final stage of this research project has involved the development of several
strategies that the teachers could pick up and use right away, given the
provision of appropriate materials. These strategies have been designed
to help children:
• articulate their “nascent understandings” of fair testing, and of experimental error;
• more consistently produce unconfounded fair tests;
• recognise and describe patterns of data variability;
• carry more of the “experimental space” in their memories, so that they can begin to recognise interactions between separate test episodes;
• talk about links between their personal theories and the “evidence” generated by their data patterns.
As Toth et al. (2000) point out, strategies that are effective in developing children’s investigative skills in small-scale experimental settings will not necessarily translate easily to the more complex reality of the classroom setting. It is important that teachers see strategies as both meaningful and manageable if they are to be useful in enhancing children’s learning. The strategies introduced in this section of the report have been introduced to some small groups of primary teachers and their ideas about their appropriate use in the classroom are included in this section.
THE
TEACHER FOCUS GROUPS
Three volunteer groups of primary teachers took part in 90-minute after-school
sessions in which 8 teaching strategies were presented and evaluated.
These focus groups were held in different geographic areas and 23 teachers
took part in total. They are currently teaching classes across the full
primary age range as shown on Table 23. Three teachers from the most rural
area taught classes that spanned more than 2 year levels. Twenty-one teachers
were female and 2 were male. Most were experienced teachers who had been
in the profession for a number of years.
Table
23
Teaching levels of the focus group participants
| Year
levels |
Number
of teachers who taught at level(s) |
| 1–2 | 2 |
| 3–4 or 4–5 or 3–5 | 6 |
| 5–6 | 4 |
| 7–8 | 5 |
| 6–8 or 5–8 | 2 |
| Not specified | 4 |
The teachers were initially asked to talk about their current methods of teaching investigative skills in science. They were then introduced to 8 potential strategies and asked to evaluate these on feedback sheets provided. During this process, they often spontaneously shared ideas about how they might adapt the strategies to their classrooms, and some teachers briefly explored new questions that arose as strategies were demonstrated with actual equipment. One page of a feedback sheet is included as Appendix 2. Teachers’ responses in the “tick box” categories of reasons for choosing to use the various resources have not been included in this report. Typically, the teachers were so enthusiastic that they ticked most boxes for most activities and so the exercise failed to sufficiently discriminate between reasons for choosing the various tasks. Instead, comments that exemplify the discussion about each strategy have been included.
TEACHERS’ IDEAS ABOUT TEACHING INVESTIGATION SKILLS
All 3 focus groups began with an invitation to the teachers to tell us
what they actually do at present to teach fair testing. In all 3 groups
most of the ideas advanced centered around discussion of the concept of
“fairness”. In all the groups teachers described ways of stimulating
children’s natural sense of “what’s not fair”
in science contexts. The emphasis was on “having children figure
it out for themselves”.
One teacher described his method as “working backwards”. Children made paper darts in any way they chose and then these were ranged against each other in competition. The ensuing indignation opened up awareness of the relevant variables at the same time as leading to a discussion of “how to make the test fair”. Another teacher spoke of linking the concept to basic statistics, using loaded and unloaded spinners to compare the frequency with which a number came up. The typical emphasis of such a discussion was on “changing one thing at a time” — often with considerable step-by-step direction from the teacher. One teacher described this as using a “set of rules”. Several teachers spoke of setting up “norms” or “controls”, which were basic experimental set-ups from which to begin changing one thing at a time.
All the ideas advanced referred to setting up a fair test. This may of course have been an artifact of the way the question we asked was interpreted. Nevertheless, no one gave an unprompted description of any strategy for fair measuring/observation, or for fair interpretation of results, or for keeping track of a sequence of related tests. Yet several of the strategies we subsequently introduced were reported to be familiar by a number of the teachers. It seems the setting-up stages are at the top of teachers’ minds when they think about fair testing in their classrooms.
There was very little discussion of problems in relation to teaching fair testing, and those that were raised were of an essentially practical nature. For example, one teacher spoke of the challenges of having different groups running different fair tests in the same context. Sometimes children look across to a seemingly more exciting group and want to change the things that that group has changed, as well as what they are supposed to be changing. On the whole, however, it seems these teachers were confident that they know what fair testing means for their children.
Several of the contexts described seemed to involve pattern seeking or exploration, rather than requiring a fair test per se. For example, one teacher spoke of making fair tests when using chromatography to explore the various colours in the sugar coats of small sweets. For her, fairness meant starting with one colour and then systematically comparing others. Another teacher spoke of fairness as “being honest” when results were not as anticipated.
Most of the teachers were unaware of the NEMP science tasks. One asked if they were the same as the Assessment Resource Banks. Another said “Well we might have used them. We don’t know what they are.”
BUILDING AWARENESS OF FAIR TESTING PROCESSES
The first 4 strategies provided alternative ways of supporting children
to initially choose fair tests, and to justify their choices. The focus
of these strategies was on exploratory and/or planning stages of the investigative
process.
Strategy One: Matched pairs of equipment
Drawn directly from the research of Toth et al. (2000) this strategy was
modelled using the Truck Track task. Two side-by-side ramps were set up
with same model cars and uniformly sized blocks of wood used to adjust
their respective heights. Ways to alter one ramp’s settings to make
it obvious that just one variable had been changed were briefly demonstrated.
The strategy supports children’s ability to recognise fair tests
by simultaneously showing the whole experimental situation.
The strategy was familiar to about half of the teachers (although none had mentioned it in their preliminary discussion) and was seen as being immediately obvious for children of all ages. Three teachers commented that the strategy could be used for making predictions:
Clearly visible. Leads to “what if….” questions. Leads to prediction. (Year 1 and 2 teacher who had not seen strategy before)
Two teachers commented on the opportunity to foster the use of everyday language as children talked spontaneously about the settings. Overall response to this strategy was very positive, as shown in Table 24. However, 2 teachers commented that the strategy was resource intensive and would have implications for their limited science budgets. They saw this being used as a whole class strategy for that reason, although a majority of the teachers thought it could be used either as a whole class or as a small group strategy.
Table 24
Teachers’ responses to Strategy One
| Response
sought |
Yes |
No |
Maybe |
No
response |
Have
you seen this strategy before? |
11 |
11 |
NR |
1 |
Would
you consider using this strategy with your class? |
23 |
Strategy
Two: Paired planning sheets
Drawn from work on representational scaffolding of children’s fair
test planning (Toth et al., 2002), this strategy was also set in the context
of the Truck Track task. Teachers were given an example of a paired planning
sheet based on this task, as shown in Figure 3. The strategy was introduced
as one that could allow children to simultaneously view all the variables
that need to be managed, reducing demands on their memory space and allowing
them to see the overall shape of their plan, and to check that only one
thing had been changed. In the example provided, children would circle
their selection for each variable, allowing both the children and their
teacher to see at a glance whether or not they have used a VOTAT (vary
one thing at a time) strategy. Older children could be given the outline
table and asked to complete variable levels for themselves.
At first sight, some teachers were more ambivalent about this strategy, especially those who teach younger children. Very few of them had seen this type of sheet before. However the written feedback gave less indication of their reservations than we had expected from the verbal comments, with most of the teachers indicating that this, too, is a strategy they would use. One said they intended to immediately file the example sheet in their science resources folder upon return to school. Responses are shown in Table 25.
Table
25
Teachers’ responses to Strategy Two
| Response
sought |
Yes |
No |
Maybe |
No
response |
Have
you seen this strategy before? |
4 |
18 |
NR |
1 |
Would
you consider using this strategy with your class? |
18 |
4 |
1 |
Figure
3
Planning sheet for the Truck Track task — option
for younger students
| Variables |
Ramp
A (Highlight in Red) |
Ramp
B (Highlight in Red) |
| Steepness of the ramp | Number
of blocks 1 2 3 4 5 |
Number
of blocks 1 2 3 4 5 |
| Car Direction | Forwards
Backwards |
Forwards
Backwards |
| Ramp Position | Straight
Crooked |
Straight
Crooked |
| Table Surface | Rough
Smooth |
Rough
Smooth |
| Ramp Surface | Rough
Smooth |
Rough Smooth |
Most teachers made written comments about this strategy, and these covered a range of areas. Four reiterated that the format could be confusing for younger children, but 3 Year 7 and 8 teachers suggested ways to modify it to show a series of sequential tests – a more complex layout! (Something similar had been prepared by us as Strategy Eight, but we had not shown that at this point.) Five teachers stressed the need for clear modelling, although they saw the effort needed to do this as worthwhile:
I liked the way it clearly made the fair test variables obvious. After “teacher talk” the children would know the variables and how to test one at a time. (Year 5 and 6 teacher who had not seen the strategy before)
This strategy was seen to support small group discussion, and to be helpful for reducing reading, language, or writing demands:
Children
have more time to think and discuss their new learning. Takes away writing
time. (Another Year 5 and 6 teacher who had not seen the strategy before)
A number of comments affirmed the potential of this strategy to make the
comparisons between tests obvious, with one commenting that it would also
help the teacher to keep track of the teaching point.
Strategy Three: Card pairs
For this strategy children are given a series of cards that show the same
situation in various different variable combinations. We modelled this
strategy with a set of Emptying Rate cards as shown in Figure 4 on the
next two pages. From amongst all the cards available to them, children
select a pair that would create a fair test for a specific question. For
example, these cards could be used to choose a fair test for questions
with a range of degrees of conceptual challenge:
- Does the size of the hole make a difference to the emptying rate for water?
- Does twice as much water take twice as much time to empty?
- Which empties faster, water or detergent?
Again, drawn directly from the research literature (Toth et al., 2001) this strategy provides a very structured visual way for children to demonstrate that they can recognise fair test situations. Selection of a pair of cards allows children to check that only one aspect is different, in much the same way as with the paired planning sheets of Strategy Two, but with visual rather than purely verbal cues. Individual cards can be manipulated into various trial combinations, making the strategy ideal for small group discussion.
Table
26
Teachers’ responses to Strategy Three
| Response
sought |
Yes |
No |
Maybe |
No
response |
| Have you seen this strategy before? | 22 |
NR |
1 |
|
| Would you consider using this strategy with your class? | 17 |
5 |
1 |
Figure
4
Examples of card pairs
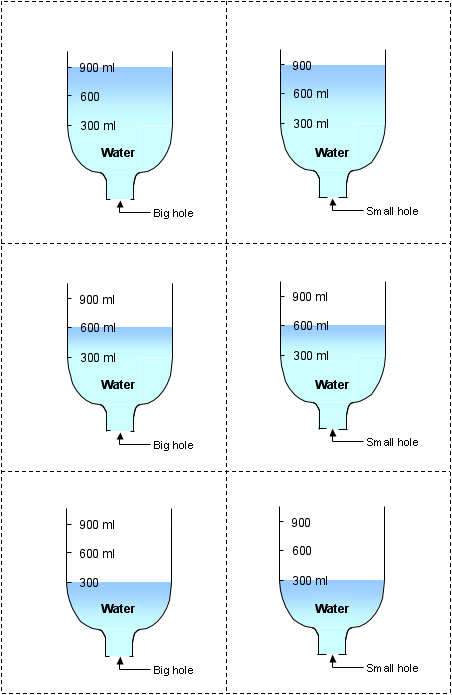
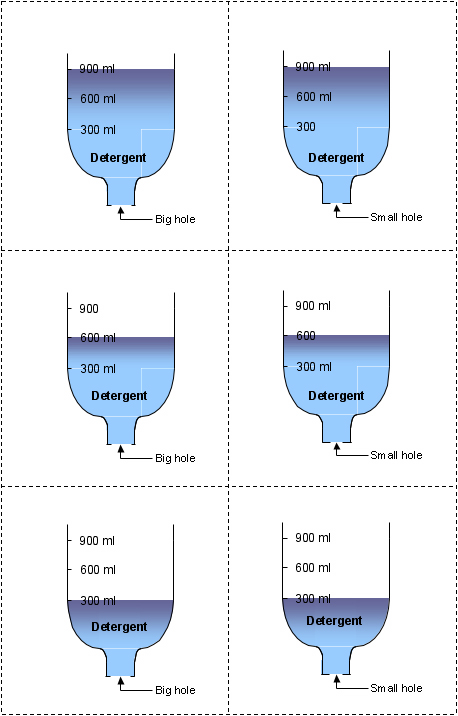
Table 26 shows that paired card selection was one of the least familiar strategies, and 5 teachers expressed ambivalence about using it. However, the possibilities for using the activity outlined above were immediately obvious to all 3 focus groups:
I liked the way it allowed children to select the fair test — this would really help the children to learn planning a fair test. It’s a great visual — children can see it and not have to imagine it. (Year 5 and 6 teacher)
I think this might be good to get the children talking and discussing to develop higher level thinking. It could give the teacher an idea of whether children can predict. [The teacher could also assess] use of language and ability to understand language (no year level given)
Those who indicated ambivalence did so for practical reasons (preparation of the necessary resources) or because they would not wish this to be a substitute for children’s experiences of actual investigations:
Still would want to give children the actual equipment after they’ve done the thinking. (Year 5 and 6 teacher)
Allows for predictions. Is a planning tool. Visual learners – very helpful for those with little reading or language skills. It would encourage them to try it in a practical situation. (Year 7 and 8 teacher)
The latter teacher also suggested making easier versions for children who did not yet have good measurement skills — if the development of these skills was not the focus of the activity. This could be done by using terms such as “quarter full, half full” instead of actual measurements. Teachers of younger children suggested a different type of simplification, with less variables depicted on any one card so that choosing test pairs was not as challenging. Modelling the use of the cards alongside a concrete demonstration of the equipment was another suggestion made for familiarising children with the demands of the activity. Two teachers felt children would lose interest if they only had the cards to work with because these would be “too abstract”.
Strategy
Four: Sequenced coaching
Toth, Khlar, and Chen (2000), recommend a combination of independent exploration
and expository instruction. Using the paired sets of equipment suggested
in Strategy One, the teacher first allows the children to explore, then
demonstrates and discusses “bad” then “good” designs.
This discussion with the children is followed by a second “bad”
then “good” demonstration round to consolidate the idea. The
children are encouraged to contribute their ideas at each stage but the
teacher is very much in control of intended learning. Children are then
given the opportunity to devise simple fair tests in groups.
The full sequence of coaching steps is presented in Figure 5. Toth et al. (2000) found this an effective sequence for teaching fair testing skills that children would remember and would be able to transfer to other contexts. For time reasons we did not model this whole sequence but rather scanned it on paper, as presented in Figure 5. This may have contributed to the ambivalence teachers expressed, although they were very clear about the reasons for their reservations:
Kids would lose interest in the process. Would demonstrate only once at [stage number] 3. Then let them do their own — don’t revisit and analyse. (Year 1 and 2 teacher)
Used over a period of time. E.g. over a whole unit to build on previous skills/knowledge. I would spend 10–15 minute sessions each time. (Year 5 and 6 teacher)
Figure
5
Sequence description provided to teachers
| 1. | Enhancing
awareness of the context With the whole class, show and talk about the equipment being used for the planned investigation, emphasising the relevant variables. Demonstrate how everything works, so that students’ familiarity with the context of the investigation is enhanced. |
NEMP
examples |
|
|
|
|
|
| 2. | Exploratory
stage In small groups, give students a simple “fair test” challenge and let them play with the equipment involved to explore the best way to make a plan for the investigation. Have students share their ideas, and talk about “fair” and “not fair” plans. . |
| 3. | Expository
instruction Demonstrate a trial design for the challenge that is “not fair”. Ask students to identify what is not fair and to say why the comparison will not answer the question posed. Follow this up with a demonstration of a “fair” test for the question posed. Ask students to identify why this comparison would allow them to find an answer to the question posed (i.e. why this arrangement is “fair”). Check that the children understand by carrying out another “not fair” then “fair” testing round, using a variation on the original question. It is important to invite students to contribute their ideas at each of these demonstration /discussion stages, but to keep control on the overall intention of the learning. ... |
| 4. | Application
stage The children again work in small groups practising their fair testing skills on similar tasks to those used by the previous exploratory phase. |
Despite these reservations, written feedback indicated that the majority of teachers would consider using the strategy, as shown in Table 27.
Table 27
Teachers’ responses to Strategy Four
| Response
sought |
Yes |
No |
Maybe |
No
response |
| Have you seen this strategy before? | 19 |
4 |
NR |
|
| Would you consider using this strategy with your class? | 17 |
1 |
3 |
2 |
Discussion about the time this sequence would take dominated the verbal feedback. Teachers were more familiar with this than with any of the other strategies but had mixed feelings about the practicality of spending so long revisiting the ideas. Teachers of younger children recognised that their children “just want to do” whilst teachers of older children worried about working with mixed groups where some were able to quickly grasp the ideas while others needed more repetition. One teacher stated that she would do this if she was “convinced” that it would be worth the effort. Another reflected on her own recognition that more attention needs to be paid to children’s learning of the skills for shaping of the fair test process:
The first stage often gets overlooked due to limited time and resources but I recognise how important it is and will now allow for it. (Year 5–8 teacher)
STRATEGIES TO MAKE PATTERNS OF EVIDENCE CLEARER
The second sequence of 4 strategies focused on ways of capturing and thinking
about the results of fair tests, once these have been carried out. As
a consequence of the observations reported in Section Three, we were interested
in modelling ways to modify data gathering so that children can see patterns
of data variability in real time (as opposed to having to carry these
in patterns in their memories, or read them retrospectively from numbers).
We wanted to model ways to simplify the cognitive demands of the measuring
tasks, thus freeing children to think about, and anticipate data variability,
and allowing more test runs to be done within the available time. The
literature we read had less to say about ways to teach skills at this
investigative stage and for these purposes and so we had to devise some
strategies of our own.
Strategy Five: Capturing patterns of data variation within
repeats of a test
We modelled this strategy in the context of the Truck Track task. The
considerable variability in individual truck runs has been described in
Section Three and this strategy was devised as a means of capturing that
variability quickly and visually. We used a large strip of brown parcel
paper as the landing surface of the truck travel zone. With whatever variables
were chosen as the beginning test, 10 runs were completed in rapid succession
and coloured dot stickers were used to mark the resting point of the truck
after each run. Each focus group agreed in advance where each sticker
would be placed — for example, “in the centre rear”,
or “beside the right front wheel”.
The teachers responded enthusiastically to this strategy, especially as the dot pattern built up. One group spontaneously decided to mark their dots with the run number, creating a sequenced pattern that led them to a discussion about whether the runs began to get longer as the truck wheels were warmed up by friction on the ramp. They recognised this as a question that could be tested using the strategy and other ideas for variations began to flow.
Table 28
Teachers’ responses to Strategy Five
| Response
sought |
Yes |
No |
Maybe |
No
response |
| Have you seen this strategy before? | 12 |
10 |
NR |
1 |
| Would you consider using this strategy with your class? | 23 |
Every teacher said they would use this strategy. Again, although more than half of them said they had seen it before, none had mentioned it during the introductory discussion.
This is very kinesthetic and manageable – you could have multiple groups doing the same test for very little cost. (Year 3–5 teacher who had not seen the strategy before)
As the teachers shared their ideas about unavoidable sources of error and the need to manage these, they also commented on opportunities for children to respond thoughtfully at all stages of the data pattern creation:
A fun and user friendly strategy. Predict before testing. (Year 7–8 teacher)
A great idea — would get them thinking and they wouldn’t really know what was being done. (Year 4–5 teacher)
Again, no writng by children. Data can be moved around. (Year 1–2 teacher)
Older students could measure from the dot centres to the ramp centre to calculate averages. Hence students could begin to learn about mathematical strategies for managing data variability that could arise and strategies for calculating and presenting data.
We did a marble run similar. We were trying to make each channel different and were looking to see what variables were needed to create it. (Year 7–8 teacher)
Can actually measure if you want to. (Year 5–6 teacher)
Creates patterns, allows use of statistics such as averages etc. (Year levels not given)
Strategy Six: Capturing patterns of “instantaneous”
measurements
Observations of the Ball Bounce task revealed the extent of the measurement
challenge that children face when required to “stop” a split-second
mark in a continuing pattern of movement – in this case determining
the very top point in the bounce of a ball. Most of the children we watched
simply guessed, repeating their measurements only if some gross deviation
led them to see a result as erroneous. We have already suggested that
collecting categoric data might provide one solution to this dilemma.
Strategy Six was our attempt to put this recommendation into action. In
this first instance, we wanted to model a way to quickly and easily collect
patterns of repeat bounces of the same ball – that is, to make a
context-appropriate strategy equivalent to that just modelled for Truck
Track as Strategy Five.
We began by modifying metre rulers that might typically be used for a task such as Ball Bounce. Using different colours of “electrical tape” purchased from a discount chain, we marked 10 cm lengths as various coloured “bounce zones”. (One advantage that occurred to us only as we did this was that we could mask at least one measurement scale on the ruler, reducing its potential ambiguity if absolute measurements were to be taken later.) Holding the ruler vertically, it is possible to quickly record at least 10 bounces for each ball, marking the appropriate zone(s) on a tally chart such as that shown in Figure 6. Even so, the top of the first bounce may not be clearly spotted and it is necessary to look directly at the likely colour zone to “stop” the highest point.
Figure 6
Model of categoric data table for Ball Bounce
Type
of ball |
Red
zone |
Blue
zone |
Green
zone |
Yellow
zone |
Black
zone |
| Tennis ball | |||||
| Squash ball | |||||
| Foam ball | |||||
| Table tennis ball |
The use of such zones allows an overall pattern for each type of ball to emerge, despite the difficulties inherent in making accurate measurements. Most teachers supported the use of this strategy — see Table 29 — and the opportunity to “get away from numbers” and to gather data more visually, was the most commonly cited reason amongst their open responses on the feedback sheets:
The colours on the ruler make it that much easier for students to identify the zone! Excellent idea! (Year 7–8 teacher)
This would help provide critical visual concepts. (Year 6–8 teacher)
Table 29
Teachers’ responses to Strategy Six
| Response sought | Yes |
No |
Maybe |
No
response |
| Have you seen this strategy before? 9 12 NR 2 | ||||
| Would you consider using this strategy with your class? 18 3 2 |
Some teachers talked about how scientists use technology to “stop” time when measurements have to be determined very quickly. They saw opportunities to combine this more visual preliminary approach with the development of some ICT skills as they video-taped the bounce trajectory of each ball against either zones or a numerical scale. Some teachers thought the “zone” strategy was better suited to younger children.
Prediction and “why” for predictions would be interesting. Students would love it. Great problem solving strategies — developing use of ICT equipment for those who want to define the area more. (Year 7–8 teacher)
While the strategy works well for gathering the bounce patterns of one type of ball, there can be a complication when 2 types of balls bounce in the same zone. This caused some reservations and discussion. Some teachers saw this as an opportunity to revise the sampling strategy to make finer grained distinctions where necessary. Others thought it would be an unsatisfactory result.
I see this as creating a pattern and a discussion point – e.g. the “high” white or “low” white – it’s easy to integrate with numeracy. (Year 1–2 teacher)
Strategy Seven: Comparing tests in a series:
Patterns on paper
Comparing categoric data for different ball bounce patterns turned the
attention of the focus group session to the need to see patterns across
related tests in a series, as well as within a specific test. The cognitive
challenges for young children have been described at some length in Section
Four. It seemed to us that almost all the NEMP groups failed to attend
to the overall “experimental space”. Few gave any thought
to sequencing tests for any reason, let alone in relation to some causal
theory. With these findings in mind, we revisited the strategy of placing
coloured dots on brown paper, but this time we used 2 sets of dots, to
directly compare a pair of VOTAT (vary one thing at a time) tests.
Again, most teachers were very enthusiastic about this strategy. And again, although nearly half said it was familiar, none had described it in the initial discussion.
Table 30
Teachers’ responses to Strategy Seven
| Response sought | Yes |
No |
Maybe |
No
response |
| Have you seen this strategy before? | 10 |
12 |
NR |
1 |
| Would you consider using this strategy with your class? | 20 |
1 |
1 |
Unsurprisingly, given their close relationship, reasons given to endorse the use of the strategy were similar to those given for Strategy Five. Teachers appreciated the visual nature of the resultant data patterns, seeing that these would lead to much discussion, and that they would stimulate predictions:
Very visual and able to make comparisons more easily, able to see clusters. (Year 3–4 teacher)
To select aspects of predictions and results that can be justified/explained. (Year 7–8 teacher)
Looking at patterns. Why? What changes? Really good to integrate with numeracy. (Year 1–2 teacher)
Strong links were seen to teachers’ numeracy programmes, and to the statistics component of Mathematics in the New Zealand Curriculum. As one teacher said “There’s your graph really. It’s done for you.” One teacher suggested beginning with whole class modelling and then letting groups investigate a question of their choice.
Strategy Eight: Comparing tests in a series: Data recording
sheets
The research literature revealed that holding a whole series of tests
in their memory space can be very challenging for children. For our final
focus group strategy we modelled a form of paper-based, relatively conventional
representational scaffolding of the type suggested by Toth et al. (2002).
This took the form of a table on which successive test results could be
entered and then directly compared. We modelled this for the Emptying
Rate task, as shown in Figure 7 on the next page.
As for the Paired Planning Sheets in Strategy Two, some teachers thought this type of recording sheet was “too much information on a page” and that children would need to be carefully taught how to use the approach. Six teachers of younger children rejected the strategy in its present form, although only 2 said unequivocally that they would not consider using it, as shown in Table 31.
Never used — emphasis is at higher age level — too much (written) recording — it’s boring to read/display/report on if children are working in co-operative groups.
(Year 1–2 teacher)Too much for younger children but it could be modified. (age levels not given)
Table 31
Teachers’ responses to Strategy Eight
Response
sought |
Yes
|
No |
Maybe |
No
response |
| Have you seen this strategy before? | 11
|
9
|
NR |
3 |
| Would you consider using this strategy with your class? | 16 |
2 |
3 |
2 |
Some teachers, while remaining cautious, saw possibilities for modification. Two suggested developing a large wall chart along the lines modelled, using this to model the recording of serial results with the whole class.
I like the clear way of showing what they have actually done and the results gained. Maybe some would need the sheet partly filled in at Year 5/6.
Figure 7
Recording sheet for a series of tests
Our
question |
What
we have varied |
What
we have kept the same |
What
happened? |
What
patterns did we find? |
||||
| Which empties fastest – the bottle with the big hole or the bottle with the small hole? | One
bottle has a small hole One bottle has a big hole |
Both
bottles have 300 mls of liquid Both bottles have water Both bottles are held straight |
|
The bottle with the big hole always empties fastest. | ||||
| Which empties fastest – water or detergent? | One
bottle has water One bottle has detergent |
Both
bottles have 300 mls of liquid Both bottles have a small hole Both bottles are held straight |
|
The water empties the fastest – but they are pretty close. | ||||
| What will happen if we try the same test with a bigger hole? | One
bottle has water One bottle has detergent |
Both
bottles have 300 mls of liquid Both bottles have a big hole Both bottles are held straight |
|
The
bottles emptied very fast. Sometimes the detergent seemed to be first but it was hard to be sure. We could try using 900 mls of liquid next time. |