|
||||||||||||||||
|
||||||||||||||||
%
responses 2008 ('04) |
||||||||||||||||
y4 |
y8 |
|||||||||||||||
| Clarity of individual instructions: (including shape, colour, place) |
high |
25 (23) |
43 (37) |
|||||||||||||
moderate |
56 (62) |
52 (55) |
||||||||||||||
low |
19 (15) |
5 (8) |
||||||||||||||
| Completeness of set of instructions: (i.e. to what extent should it have allowed the participants to create the desired picture) |
all details covered |
35 (26) |
55 (55) |
|||||||||||||
most details covered (1-2 wrong) |
32 (39) |
33 (27) |
||||||||||||||
moderately complete (2+ wrong) |
27 (29) |
11 (15) |
||||||||||||||
very incomplete |
6 (6) |
1 (3) |
||||||||||||||
| Efficiency of set of instructions: (e.g. sequenced in correct sensible order; extent to which correct positions signalled without need for corrective instructions) |
very efficient (no questions) |
16 (11) |
31 (23) |
|||||||||||||
moderately efficient (few questions) |
64 (68) |
63 (69) |
||||||||||||||
inefficient |
20 (21) |
6 (8) |
||||||||||||||
Total
score: |
7 |
9 (6) |
23 (15) |
|||||||||||||
6 |
11 (9) |
16 (19) |
||||||||||||||
5 |
22 (18) |
27 (29) |
||||||||||||||
3–4 |
37 (48) |
29 (29) |
||||||||||||||
0–2 |
21 (19) |
5 (8) |
||||||||||||||
| Subgroup Analysis [Click on charts to enlarge] : |
| Commentary: |
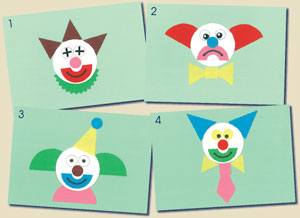
| This was a very popular task with a wide range of performance. Presenting a clear, complete and efficient set of instructions for such tasks is not easy. The improvement from year 4 to year 8 was moderate. There was little change from 2004 to 2008. At the bottom end, year 8 Pasifika students scored poorly, almost unchanged from year 4 Pasifika students. |


