|
|||||||||||||||
|
|||||||||||||||
%
responses 2008 ('04) |
|||||||||||||||
y4 |
y8 |
||||||||||||||
| Topic 1: Fizzy drinks should be sold at school: | |||||||||||||||
| Support of topic: |
strongly in favour |
2 (2) |
10 (5) |
||||||||||||
mildly in favour |
8 (8) |
7 (22) |
|||||||||||||
equivocal/neutral/unsure/unclear |
10 (18) |
25 (24) |
|||||||||||||
mildy against |
19 (22) |
25 (33) |
|||||||||||||
strongly against |
61 (50) |
33 (16) |
|||||||||||||
| Topic 2: School holidays should be longer |
|||||||||||||||
| Support of topic: | strongly in favour |
19 (16) |
20 (16) |
||||||||||||
mildly in favour |
12 (15) |
25 (31) |
|||||||||||||
equivocal/neutral/unsure/unclear |
27 (16) |
28 (28) |
|||||||||||||
mildy against |
20 (20) |
15 (23) |
|||||||||||||
strongly against |
22 (33) |
12 (2) |
|||||||||||||
| Topic 3: Talking in class helps you learn | |||||||||||||||
| Support of topic: |
strongly in favour |
10 (4) |
17 (8) |
||||||||||||
mildly in favour |
17 (11) |
24 (34) |
|||||||||||||
equivocal/neutral/unsure/unclear |
21 (34) |
45 (39) |
|||||||||||||
mildy against |
21 (20) |
9 (11) |
|||||||||||||
strongly against |
31 (31) |
5 (8) |
|||||||||||||
| Topic 4: Maths is the most important school subject |
|||||||||||||||
| Support of topic: | strongly in favour |
31 (34) |
12 (15) |
||||||||||||
mildly in favour |
21 (21) |
22 (17) |
|||||||||||||
equivocal/neutral/unsure/unclear |
22 (23) |
37 (32) |
|||||||||||||
mildy against |
12 (8) |
17 (32) |
|||||||||||||
strongly against |
14 (14) |
12 (4) |
|||||||||||||
| OVERALL: | |||||||||||||||
| Clarity of points made: |
high |
9 (6) |
21 (14) |
||||||||||||
moderate |
58 (50) |
61 (64) |
|||||||||||||
low |
33 (44) |
18 (22) |
|||||||||||||
| Relevance of arguments to
viewpoints expressed: |
high |
11 (8) |
29 (17) |
||||||||||||
moderate |
64 (64) |
54 (66) |
|||||||||||||
low |
25 (28) |
17 (17) |
|||||||||||||
| Overall strength of arguments
in support of viewpoints: |
high |
5 (4) |
18 (8) |
||||||||||||
moderate |
38 (35) |
55 (46) |
|||||||||||||
low |
57 (61) |
27 (46) |
|||||||||||||
Total
score: |
4–6 |
14 (10) |
34 (21) |
||||||||||||
3 |
26 (25) |
37 (33) |
|||||||||||||
2 |
22 (18) |
8 (19) |
|||||||||||||
1 |
21 (24) |
9 (15) |
|||||||||||||
0 |
17 (23) |
12 (12) |
|||||||||||||
| Subgroup Analysis [Click on charts to enlarge] : |
Year 4 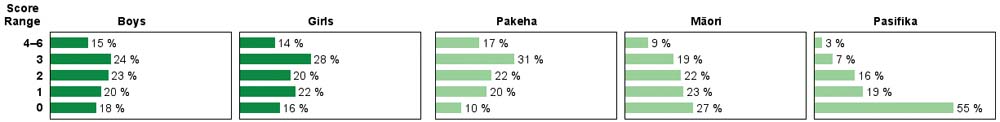 |
||
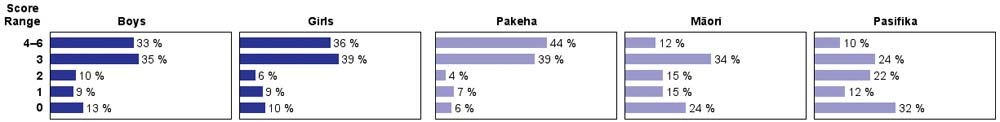
| Commentary: |
| While the views expressed are recorded here, the total score is based on the final three criteria which were judged for each student separately. More year 8 students achieved high scores in 2008 than 2004, but there was little change from 2004 to 2008 for year 4 students. Year 8 Mäori and both year 4 and 8 Pasifika students averaged substantially lower than their Pakeha counterparts.
|