|
: Weather
|
|
||||||||
| Resources: 5 sets of 4 cards with words and (for all except months) pictures: |
||||||||
| 1:
July |
swimming at the beach | average temperature 13 degrees this month | blossom on trees | |||||
| 2: January | skiing | average temperature 9 degrees | this month leaves falling off trees | |||||
| 3: May | planting the garden | average temperature 20 degrees | this month fruit growing on trees | |||||
| 4:
October The 5th set on blue card |
playing hockey | average temperature 14 degrees | this month no leaves on trees | |||||
| 5: lots of sunshine | 10 days of rain this month | 15 days of rain this month | 18 days of rain this month | |||||
|
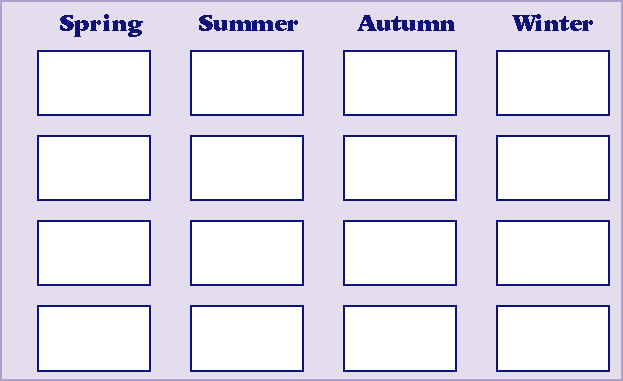
Laminated chart to place cards on: |
||||||||
 |
||||||||
| Questions
/ instructions: The first thing I want you to do is to look at your cards and show them to the others in your group, so that everyone can see all of the cards. I want you to tell the others what is on each of your cards. Here are your cards so that you can do that now. Now I am going to give your team a chart for putting the cards on. As a group, I want you to decide how you will arrange the cards on the chart. Arrange them so that each column on the chart has a set of cards that belong to the same season. Only put one card on each space. Here is the chart. |
||||||||
| % responses | ||||||||
| y4 |
||||||||
|
Place the chart in front of the team. When the chart is complete,
ask: Discussion
rated very good |
17 49 |
|||||||
| Each
person can explain one column on the chart. Good
explanations: Spring |
20 32 15 31 |
|||||||
| Note
that a "column" runs vertically on the chart. Explain this
to the students. Discussion
rated very good good |
14 41 |
|||||||
[ top of the page | Science Report 1995 ]