|
||||||||||||||
|
||||||||||||||
%
responses 2007 ('03) |
||||||||||||||
y4 |
y8 |
|||||||||||||
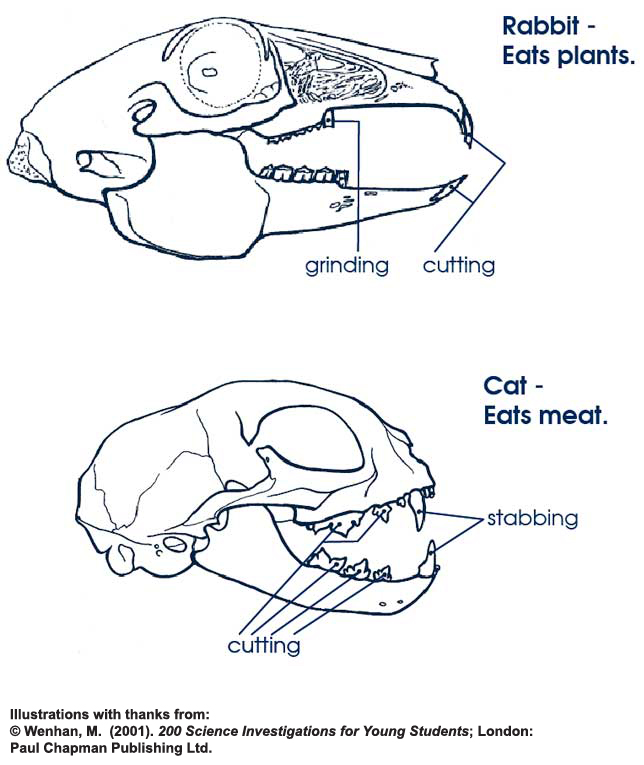
| Look at these dinosaur skulls. Write down what sorts of foods you think these dinosaurs ate - plants, or animals. [Illustrations, with thanks, from: © Creagh, C., Milner, A. (ed.) (1995). Dinosaurs; Sydney: Allen & Unwin.] |
||||||||||||||
 |
1. What it eats: |
plants |
69 (81) |
88 (89) |
||||||||||
| How can you tell it eats this? | ||||||||||||||
| Explanation: (grinding teeth; flat teeth (not sharp); teeth at back of mouth) |
||||||||||||||
two or more valid reasons |
1 (0) |
5 (10) |
||||||||||||
one valid reason |
28 (35) |
47 (52) |
||||||||||||
alternatively explained as
looking like rabbit teeth |
2 (3) |
5 (4) |
||||||||||||
 |
2. What it eats: |
meat |
84 (91) |
95 (96) |
||||||||||
| How can you tell it eats this? | ||||||||||||||
| Explanation: (sharp/jagged/stabbing teeth, mixed sizes; teeth go right to front of mouth) |
||||||||||||||
two or more valid reasons |
1 (1) |
3 (4) |
||||||||||||
one valid reason |
51 (59) |
73 (74) |
||||||||||||
alternatively explained as
looking like cat teeth |
2 (0) |
3 (3) |
||||||||||||
 |
3. What it eats: |
plants |
79 (91) |
93 (94) |
||||||||||
| How can you tell it eats this? | ||||||||||||||
| Explanation: (grinding teeth; flat teeth (not sharp); teeth at back of mouth) |
||||||||||||||
two or more valid reasons |
1 (1) |
3 (5) |
||||||||||||
one valid reason |
39 (59) |
56 (62) |
||||||||||||
alternatively explained as
looking like rabbit teeth |
1 (2) |
4 (2) |
||||||||||||
 |
4. What it eats: |
meat |
83 (91) |
95 (96) |
||||||||||
| How can you tell it eats this? | ||||||||||||||
| Explanation: (sharp/jagged/stabbing teeth; mixed sizes; teeth go right to front of mouth) |
||||||||||||||
two or more valid reasons |
1 (1) |
3 (3) |
||||||||||||
one valid reason |
47 (55) |
72 (76) |
||||||||||||
alternatively explained as
looking like cat teeth |
1 (3) |
2 (2) |
||||||||||||
Total
score: |
9–16 |
3 (3) |
10 (14) |
|||||||||||
7–8 |
28 (41) |
48 (54) |
||||||||||||
5–6 |
25 (24) |
24 (17) |
||||||||||||
3–4 |
28 (24) |
14 (11) |
||||||||||||
0–2 |
16 (8) |
4 (4) |
||||||||||||
| Subgroup Analysis [Click on charts to enlarge] : |
Year 4 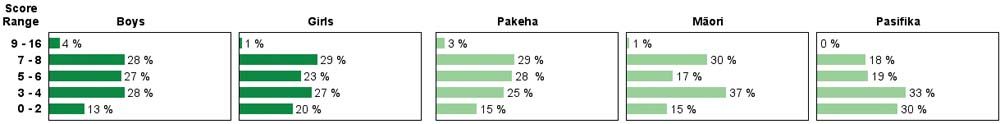 |
||
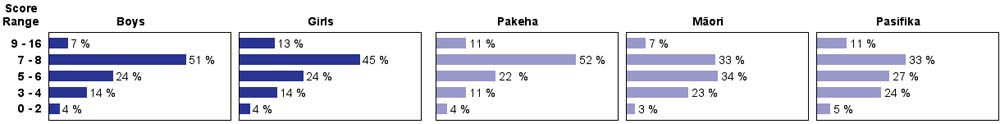
| Commentary: |
| There was a moderate decline in performance between 2003 and 2007 for year 4 students, with little change for year 8 students. Year 4 Pakeha and Mäori students performed similarly. |