|
||||||||||||||||
|
||||||||||||||||
%
responses 2007 ('03) |
||||||||||||||||
y4 |
y8 |
|||||||||||||||
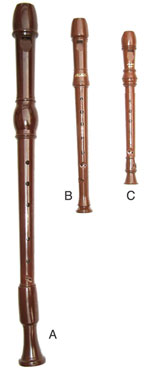
| Look at the picture of the musical instruments. Draw a circle around the best answer for each question. 1. Which one makes the lowest sounds: |
||||||||||||||||
53 (62) |
76 (76) |
|||||||||||||||
B |
5 (3) |
2 (1) |
||||||||||||||
C |
39 (34) |
21 (23) |
||||||||||||||
| 2. Which one makes the highest sounds: | ||||||||||||||||
A |
38 (34) |
20 (22) |
||||||||||||||
B |
8 (4) |
4 (4) |
||||||||||||||
51 (60) |
75 (74) |
|||||||||||||||
| Blow over the top of each straw, like the person in the photo. 3. Which straw gives the lowest sounds: |
||||||||||||||||
57 (62) |
79 (73) |
|||||||||||||||
blue |
33 (29) |
16 (22) |
||||||||||||||
yellow |
7 (6) |
4 (4) |
||||||||||||||
| 4. Which straw gives the
highest sounds: |
||||||||||||||||
red |
31 (31) |
14 (20) |
||||||||||||||
47 (56) |
66 (61) |
|||||||||||||||
yellow |
19 (11) |
19 (17) |
||||||||||||||
| 5. What causes the sounds to be
higher or lower? |
||||||||||||||||
length of instrument determines
wavelength of sound waves, therefore
frequency, therefore pitch |
0 (2) |
1 (3) |
||||||||||||||
clearly associated length with pitch
(longer/lower) |
14 (17) |
30 (22) |
||||||||||||||
vaguely linked length/size with pitch
(but does not give direction) |
42 (41) |
55 (57) |
||||||||||||||
| Look at the picture of the musical instruments again. 6. Which instrument makes the lowest sound: |
||||||||||||||||
53 (64) |
79 (74) |
|||||||||||||||
B |
6 (4) |
4 (2) |
||||||||||||||
C |
37 (28) |
17 (24) |
||||||||||||||
| 7. Why do you think this instrument makes the lowest sound? |
||||||||||||||||
length of instrument determines
wavelength of sound waves, therefore
frequency, therefore pitch |
0 (2) |
1 (1) |
||||||||||||||
clearly associated length with pitch
(longer/lower) |
6 (11) |
17 (24) |
||||||||||||||
vaguely linked length/size with pitch
(but does not give direction) |
39 (44) |
59 (50) |
||||||||||||||
Total
score: |
8–11 |
10 (12) |
29 (27) |
|||||||||||||
6–7 |
25 (41) |
37 (34) |
||||||||||||||
4–5 |
18 (8) |
15 (16) |
||||||||||||||
2–3 |
18 (14) |
11 (12) |
||||||||||||||
0–1 |
29 (25) |
8 (11) |
||||||||||||||
| Subgroup Analysis [Click on charts to enlarge] : |
| Commentary: |
| This task showed strong increases in performance from year 4 to year 8. The 2003 and 2007 results were similar. |


