|
||||||||||||||
|
||||||||||||||
%
responses 2007 ('03) |
||||||||||||||
y4 |
y8 |
|||||||||||||
|
||||||||||||||
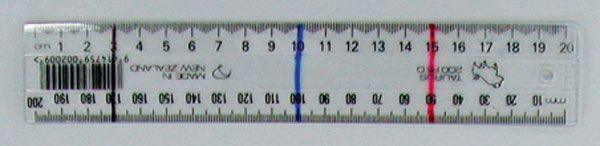
| Prediction: | red marker |
3 (2) |
1 (0) |
|||||||||||
black marker |
7 (6) |
5 (4) |
||||||||||||
91 (92) |
95 (95) |
|||||||||||||
no answer or more than one answer |
0 (0) |
0 (0) |
||||||||||||
| Hand out
shorter rod. Now try it out and see what happens. 2. Do you want to change your answer? |
||||||||||||||
| Result: | red marker |
0 (0) |
0 (0) |
|||||||||||
black marker |
3 (1) |
3 (2) |
||||||||||||
blue marker |
6 (3) |
1 (3) |
||||||||||||
no change |
90 (95) |
94 (94) |
||||||||||||
no answer or more than one answer |
1 (1) |
2 (1) |
||||||||||||
Show longer rod and indicate heavy end. |
||||||||||||||
| Prediction: | red marker |
21 (23) |
9 (11) |
|||||||||||
63 (51) |
63 (60) |
|||||||||||||
blue marker |
14 (25) |
25 (28) |
||||||||||||
no answer or more than one answer |
2 (1) |
3 (1) |
||||||||||||
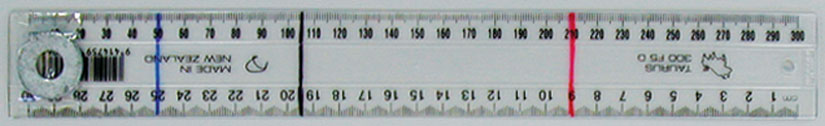
| Hand out weighted rod. Now try it out and see what happens. 4. Do you want to change your answer? |
||||||||||||||
| Result: | red marker |
2 (1) |
1 (1) |
|||||||||||
black marker |
33 (46) |
32 (39) |
||||||||||||
blue marker |
3 (2) |
0 (1) |
||||||||||||
no change |
57 (49) |
63 (57) |
||||||||||||
no answer or more than one answer |
5 (2) |
4 (2) |
||||||||||||
|
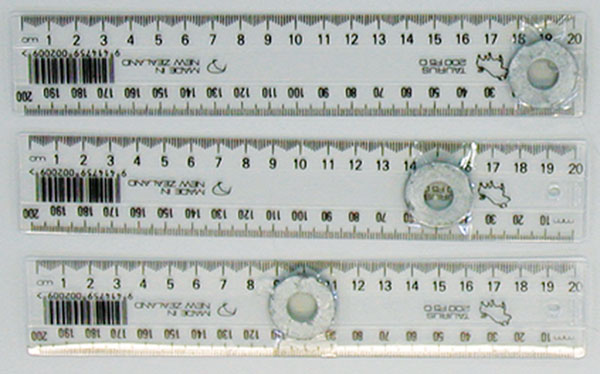
Here are three more rods. Each rod has a weight on it. Find where to put your finger so that each rod balances. Use the whiteboard pen to mark on the rod where your finger was. Hand out rods. Now look at where the weights are and the pen marks showing where your finger was. 5. What do you notice about where the weights and the pen marks are on the rods? |
|||||||||||||
markers are close to the weights |
42 (41) |
43 (57) |
||||||||||||
| Description: (Distance between weight and markers (balance points) increases as weight gets closer to end of ruler) |
clear, accurate description |
1 (1) |
4 (12) |
|||||||||||
on right track, but vague |
7 (5) |
15 (25) |
||||||||||||
Total
score: |
4–5 |
2 (2) |
8 (16) |
|||||||||||
3 |
27 (21) |
39 (38) |
||||||||||||
2 |
47 (44) |
35 (35) |
||||||||||||
0–1 |
24 (33) |
18 (11) |
||||||||||||
| Subgroup Analysis [Click on charts to enlarge] : |
Year 4 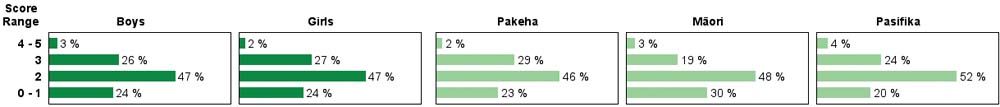 |
||
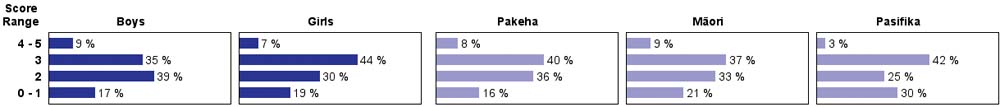
| Commentary: |
| There was little change between year 4 and year 8 on this task, nor for year 4 students between 2003 and 2007. The performance of year 8 students dropped a little between 2003 and 2007. Mäori and Pasifika students at both year levels performed similarly to Pakeha students. |