|
||||||||||||||
|
||||||||||||||
%
responses 2007 ('03) |
||||||||||||||
y4 |
y8 |
|||||||||||||
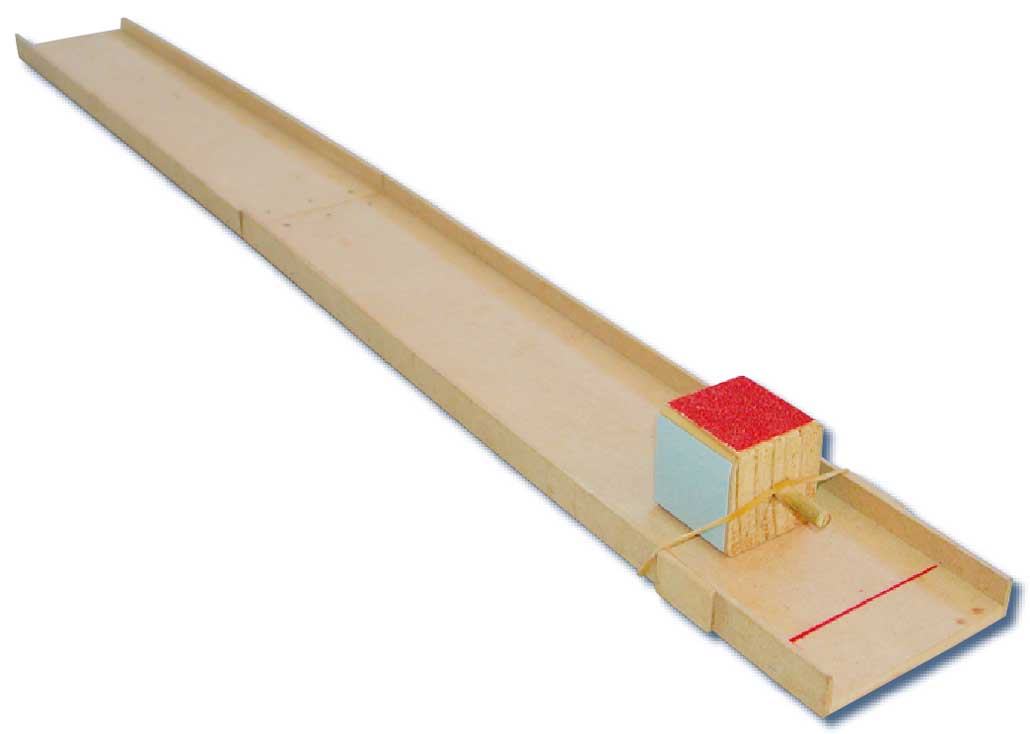
| 1. Which side touching the board
do you think will make the
block slide further? |
||||||||||||||
77 (75) |
82 (87) |
|||||||||||||
wood |
5 (6) |
5 (7) |
||||||||||||
flannel |
14 (18) |
12 (6) |
||||||||||||
sandpaper |
3 (0) |
0 (0) |
||||||||||||
| 2. Why do you think that? |
||||||||||||||
less “friction” |
0 (2) |
4 (9) |
||||||||||||
smooth, slippery, less catching/
rubbing/grippy |
74 (79) |
84 (81) |
||||||||||||
| 3. Which one of the four sides do you think will prevent the block from sliding as far? | ||||||||||||||
plastic |
2 (5) |
1 (0) |
||||||||||||
wood |
4 (1) |
1 (1) |
||||||||||||
flannel |
17 (6) |
9 (8) |
||||||||||||
77 (86) |
89 (90) |
|||||||||||||
| 4. Why do you think that? |
||||||||||||||
more “friction” |
0 (0) |
5 (12) |
||||||||||||
rough, more catching/rubbing/grippy |
58 (70) |
80 (78) |
||||||||||||
| Now you can test out your ideas. Put the side you are testing face down and next to the rubber band. Lift the rubber band so it sits on top of the peg and pull the block back to the line. Then let it go. If necessary help the student set up the block. 5. What did you find out? prompt: Explain why that happened. |
||||||||||||||
| Tested all sufaces: |
yes (without prompting) |
12 (15) |
19 (30) |
|||||||||||
yes (with prompting) |
51 (53) |
55 (50) |
||||||||||||
no |
37 (32) |
26 (20) |
||||||||||||
| Reported: | sandpaper least distance |
53 (58) |
61 (56) |
|||||||||||
| For slide furthest, reported: |
plastic |
78 (78) |
85 (85) |
|||||||||||
wood |
6 (5) |
3 (6) |
||||||||||||
flannel |
1 (2) |
2 (2) |
||||||||||||
| Quality of
explanation: |
very good (“friction”) |
0 (0) |
8 (9) |
|||||||||||
good (smooth plus) |
2 (4) |
7 (5) |
||||||||||||
fair (smooth vs. rough) |
51 (58) |
61 (57) |
||||||||||||
poor/missing |
47 (38) |
24 (29) |
||||||||||||
Total
score: |
4–6 |
35 (49) |
66 (68) |
|||||||||||
3 |
31 (24) |
18 (23) |
||||||||||||
2 |
23 (17) |
13 (8) |
||||||||||||
0–1 |
11 (10) |
3 (1) |
||||||||||||
| Subgroup Analysis [Click on charts to enlarge] : |
Year 4 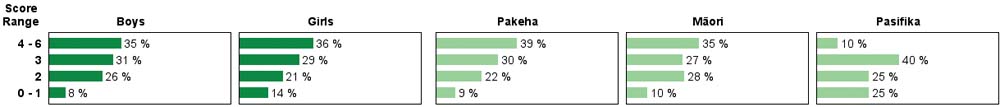 |
||
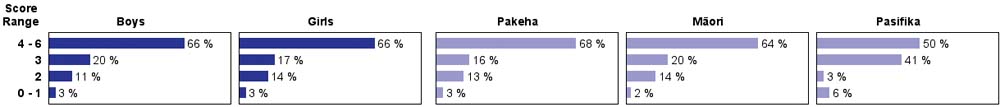
| Commentary: |
| The performance of the apparatus for this popular task was a little erratic, so that the anticipated results were not always observed. The total score focused on prediction and explanation, rather than experimental findings. There was a moderate decline in the performance of year 4 students between 2003 and 2007. Mäori students performed similarly to Pakeha students. |