|
||||||||||||||||
|
||||||||||||||||
%
responses 2007 ('03) |
||||||||||||||||
y4 |
y8 |
|||||||||||||||
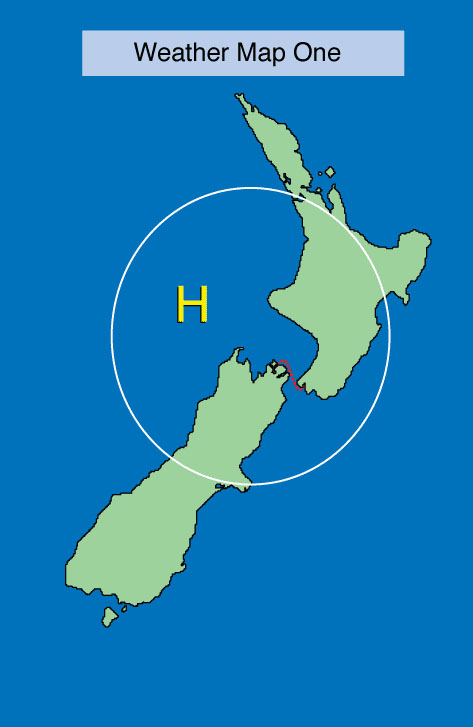 [Click on graphic to enlarge.] |
Show map one. This map shows the weather for one day. There is a red dotted line to show you where the boat will be going from the North Island to the South Island. 1. What do you think the weather will be like on this day for going on the ferry boat? |
|||||||||||||||
calm |
3 (4) |
16 (10) |
||||||||||||||
clear, fine/sunny |
25 (29) |
28 (38) |
||||||||||||||
hot, warm (and/or cool at night) |
55 (50) |
51 (47) |
||||||||||||||
a good day |
13 (17) |
25 (20) |
||||||||||||||
| 2. How does the map tell you that the weather will be like that? | ||||||||||||||||
| ‘H’: | ||||||||||||||||
means high pressure/anticyclone |
0 (1) |
4 (6) |
||||||||||||||
means high |
15 (21) |
27 (27) |
||||||||||||||
related to temperature / hot |
44 (39) |
37 (33) |
||||||||||||||
no relevant comment |
41 (39) |
32 (34) |
||||||||||||||
no close-together circles/lines
(isobars) mean little wind |
1 (3) |
7 (7) |
||||||||||||||
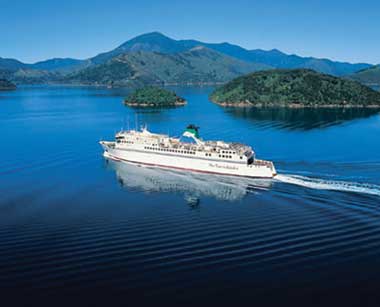
 [Click on graphic to enlarge.] |
Show map two. This map shows the weather for another day. 3. What do you think the weather will be like on this day for going on the ferry boat? |
|||||||||||||||
windy |
43 (50) |
67 (67) |
||||||||||||||
southerly |
1 (1) |
3 (5) |
||||||||||||||
(relatively) cool / cold |
31 (31) |
41 (41) |
||||||||||||||
a bad day |
9 (16) |
19 (15) |
||||||||||||||
cloudy/rainy/stormy |
31 (25) |
24 (30) |
||||||||||||||
| 4. How does the map tell you that the weather will be like that? | ||||||||||||||||
| ‘L’: | ||||||||||||||||
means low pressure/depression |
1 (0) |
5 (7) |
||||||||||||||
means low |
11 (8) |
32 (39) |
||||||||||||||
related to temperature / cold |
29 (29) |
12 (12) |
||||||||||||||
no relevant comment |
59 (63) |
51 (42) |
||||||||||||||
circles / lines close together
(isobars) mean wind |
16 (16) |
35 (26) |
||||||||||||||
location of lines, front, ‘L’ – all suggest
southerly (at least one mentioned and
that it suggests southerly) |
2 (2) |
6 (7) |
||||||||||||||
cold front symbol supports
cold temperature |
2 (0) |
9 (11) |
||||||||||||||
Total
score: |
5–14 |
3 (9) |
20 (23) |
|||||||||||||
4 |
9 (6) |
16 (18) |
||||||||||||||
3 |
22 (22) |
24 (24) |
||||||||||||||
2 |
28 (23) |
20 (22) |
||||||||||||||
0–1 |
38 (40) |
20 (13) |
||||||||||||||
| Subgroup Analysis [Click on charts to enlarge] : |
Year 4 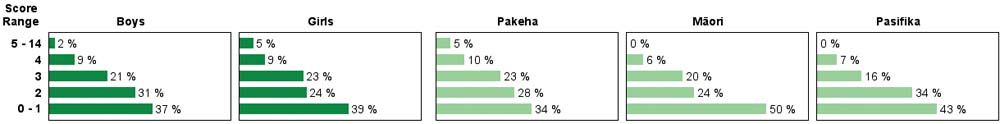 |
||
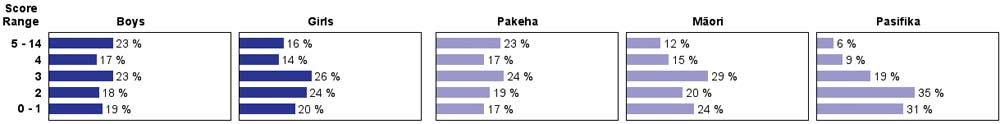
| Commentary: |
| Students at both year levels showed quite limited understanding of the meaning of the symbols H and L on weather maps, tending to associate them with temperature rather than air pressure. In fact, an H is not always associated with warm weather or an L with cold weather. Overall, performance was quite low, with little evidence of change between 2003 and 2007. |