| Approach: Station |
Level:
Year 4
and year 8 |
|
| Focus:
Generating
and evaluating possible design solutions
|
| Resources:
Picture
|
 |
6.5MB |
|
|
| Questions/instructions:
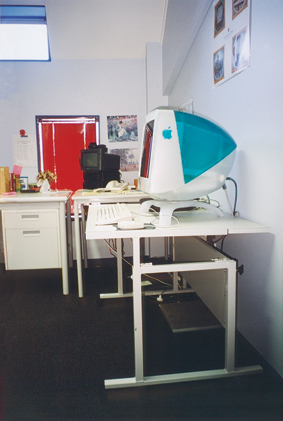
This picture shows a computer on a special table.
A special computer chair is needed that would be good for both children
and adults to use at home.

|
|
%
responses
2004 ('00) |
| y4
|
y8 |
| 1.
Make a drawing of a chair. |
|
|
| 2.
On your drawing write labels to show how it would work, and why it would
be good for both children and adults. |
|
|
Features
included: |
legs/pedestal |
98
(97) |
98
(96) |
| |
seat
|
99
(99) |
98
(98) |
| |
back
|
98
(100) |
97
(97) |
| |
padding
|
63
(71) |
78
(78) |
arm
rest (not necessarily desirable) |
19
(22) |
30
(27) |
Castors/wheels: |
feature included |
73
(62) |
80
(64) |
| |
explanation
of how it works |
34
(33) |
47
(42) |
Swivel
seat: |
feature included |
10
(10) |
13
(15) |
| |
explanation
of how it works |
8
(7) |
8
(10) |
Seat
height adjustment: |
feature
included |
53
(36) |
73
(73) |
|
explanation
of how it works |
46
(32) |
65
(63) |
|
explanation
of value of feature |
25
(12) |
41
(32) |
Foot
rest/adjustment: |
feature
included |
6
(8) |
9
(8) |
|
explanation
of how it works |
4
(2) |
7
(5) |
|
explanation
of value of feature |
2
(2) |
3
(4) |
Back
height adjustment: |
feature
included |
10
(11) |
18
(15) |
| |
explanation
of how it works |
8
(9) |
14
(10) |
| |
explanation
of value of feature |
4
(3) |
9
(3) |
Back
tilt adjustment: |
feature included |
14
(12) |
27
(26) |
| |
explanation
of how it works |
7
(9) |
21
(18) |
| |
explanation
of value of feature |
3
(3) |
13
(9) |
Total
score: |
13–21
|
2
(0) |
9
(2) |
| |
10–12
|
12
(11) |
25
(27) |
7–9
|
42
(34) |
41
(45) |
4–6 |
35
(44) |
20
(18) |
0–3 |
9
(11) |
5
(8) |
Commentary:
Almost all students included the core requirements of a chair –
legs, seat and back. Most also included padding and castor wheels, while
many included seat height adjustment. Success in addressing the full requirements
of adjustability for different body sizes and preferences was much more
limited. About 20 percent more year 8 than year 4 students scored 10 or
more. There was little change between 2000 and 2004 at either year level.
|