|
||||||||||||||||
|
||||||||||||||||
%
responses 2008 ('04) |
||||||||||||||||
y4 |
y8 |
|||||||||||||||
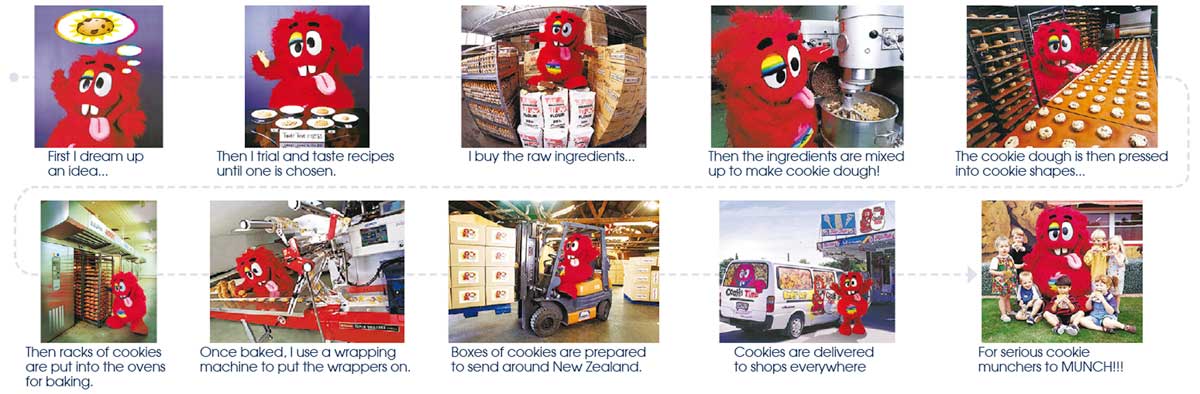
| 1. Why do you think they trial and test new recipes? | ||||||||||||||||
make sure people like the taste of them (so they will buy them/get the best one) |
55 (60) |
73 (69) |
||||||||||||||
make sure recipe works well |
9 (7) |
14 (15) |
||||||||||||||
to avoid negative effects to the
company/business (i.e., check works well so don’t lose money/avoid bad results, harm, loss of reputation to the company) |
4 (7) |
4 (6) |
||||||||||||||
| 2. How do you think they would trial and test new recipes? | ||||||||||||||||
survey (ask) people about the
cookie they might like |
1 (1) |
9 (4) |
||||||||||||||
| Make up new recipes: | same recipe several times |
4 (4) |
10 (7) |
|||||||||||||
once |
18 (10) |
15 (15) |
||||||||||||||
get possible customers to trial/taste/
eat new biscuit recipes |
43 (45) |
62 (68) |
||||||||||||||
get customer’s opinions (have people
taste new biscuits and give feedback) |
4 (8) |
12 (9) |
||||||||||||||
| 3. Try to give three reasons why the biscuits are wrapped. | ||||||||||||||||
fresh |
47 (40) |
68 (67) |
||||||||||||||
health/hygiene reasons (prevent
people touching or eating them) |
62 (74) |
74 (75) |
||||||||||||||
marketing/advertising of
brand/use of bar codes |
10 (15) |
28 (17) |
||||||||||||||
nutrition/ingredients information |
5 (7) |
13 (5) |
||||||||||||||
Total
score: |
5–10 |
6 (9) |
29 (18) |
|||||||||||||
3–4 |
46 (43) |
54 (65) |
||||||||||||||
2 |
30 (34) |
11 (14) |
||||||||||||||
1 |
14 (11) |
4 (3) |
||||||||||||||
0 |
4 (3) |
2 (1) |
||||||||||||||
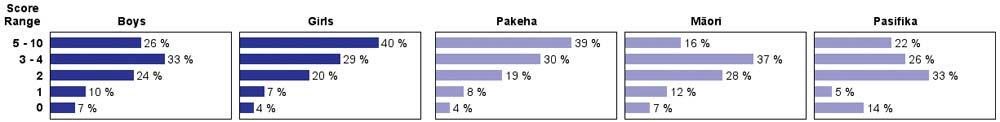
| Subgroup Analysis [Click on charts to enlarge] : |
Year 4 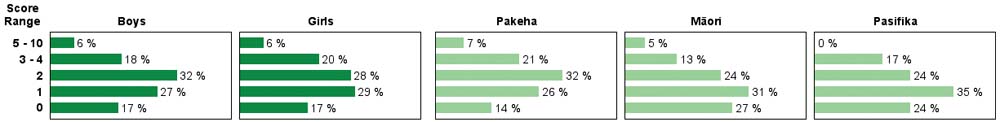 |
||
| Commentary: |
| Most students were able to provide good reasons for why a cookie factory develops and tests new ideas for cookies, and why they wrap their product. There was moderate growth seen from year 4 to year 8. There were minimal gender differences at year 4, but girls outperformed boys at year 8. Pakeha students outperformed Mäori and Pasifika students at year 4 and year 8. Moderate growth was seen from 2004 to 2008 at year 8.
|