|
||||||||||||||||
|
||||||||||||||||
%
responses 2008 ('04) |
||||||||||||||||
y4 |
y8 |
|||||||||||||||
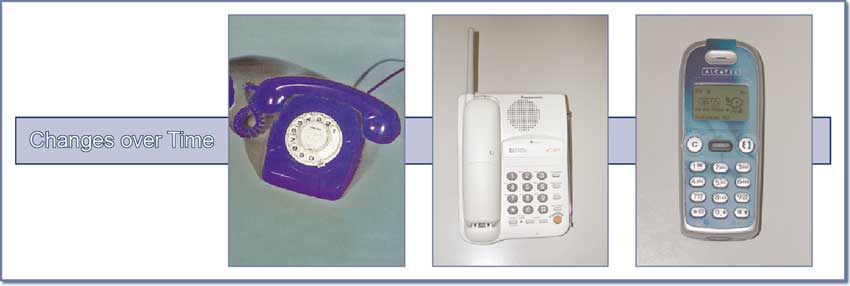
| 1. Phones and people’s lives have changed a lot over time. Tell me about how the technology used in phones has changed. | ||||||||||||||||
| Changes mentioned: | lighter/smaller/more portable |
45 (46) |
70 (79) |
|||||||||||||
change from cord handsets to
cordless handsets |
40 (35) |
64 (71) |
||||||||||||||
change from landline unit to cellular |
32 (31) |
52 (54) |
||||||||||||||
| Additional efficiencies: (e.g. push buttons, redial, stored numbers) | 78 (76) |
84 (78) |
||||||||||||||
| Non-telephone functions: (e.g. texting, photos, e-mail, games) | 37 (41) |
57 (63) |
||||||||||||||
| 2. How have the changes in telephones changed how people use them? |
||||||||||||||||
able to use them in wider range of places |
35 (39) |
63 (62) |
||||||||||||||
able to be contacted a higher proportion
of the time/more quickly |
4 (3) |
19 (21) |
||||||||||||||
texting has partially replaced phoning,
e-mail, passing notes |
15 (9) |
35 (36) |
||||||||||||||
used for entertainment, visual
communication |
8 (6) |
14 (23) |
||||||||||||||
| Now let’s think just about cell phones. Show cell phone picture. [Same image as cell phone at right above] 3. What are the good things about cell phones? |
||||||||||||||||
take them with you and use them
just about everywhere |
59 (54) |
75 (83) |
||||||||||||||
use in safety/security situations |
11 (14) |
24 (22) |
||||||||||||||
texting and e-mail capabilities |
55 (48) |
77 (68) |
||||||||||||||
entertainment device |
50 (50) |
53 (51) |
||||||||||||||
| 4. What are some of the not so good things about cell phones? |
||||||||||||||||
people expect you to be available
all the time |
1 (3) |
3 (2) |
||||||||||||||
health dangers (distraction when driving,
electromagnetic radiation, etc) |
8 (5) |
22 (16) |
||||||||||||||
cost (of instrument and use) |
28 (30) |
41 (60) |
||||||||||||||
text bullying |
6 (3) |
23 (8) |
||||||||||||||
phone coverage (poor or unavailable in some areas) |
6 (8) |
18 (11) |
||||||||||||||
battery (running low/recharging/battery life) |
38 (35) |
36 (47) |
||||||||||||||
| 5. Why do the people who design and make phones always want to have new ideas? |
||||||||||||||||
to make money/improve market share |
32 (26) |
55 (69) |
||||||||||||||
to improve services for people |
16 (23) |
40 (32) |
||||||||||||||
very well |
2 (0) |
10 (13) |
||||||||||||||
| Overall, how well did student understand and explain? | ||||||||||||||||
quite well |
10 (8) |
31 (32) |
||||||||||||||
moderately well |
36 (34) |
44 (40) |
||||||||||||||
poorly |
52 (58) |
16 (15) |
||||||||||||||
Total
score: |
13–24 |
3 (3) |
30 (33) |
|||||||||||||
10–12 |
14 (9) |
32 (33) |
||||||||||||||
7–9 |
32 (29) |
28 (23) |
||||||||||||||
4–6 |
34 (45) |
9 (11) |
||||||||||||||
0–3 |
17 (13) |
2 (1) |
||||||||||||||
| Subgroup Analysis [Click on charts to enlarge] : |
Year 4 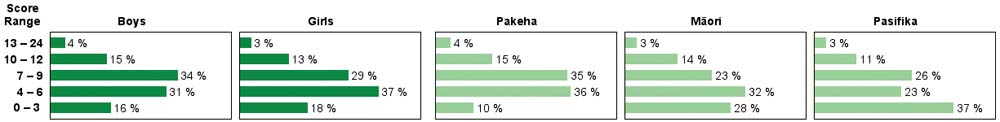 |
||
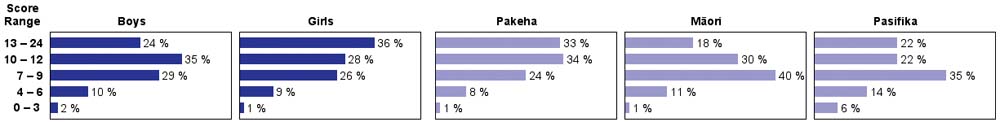
| Commentary: |
| Most students were able to describe how phones have changed over time and identify positive and negative aspects of cell phones. Strong growth was seen from year 4 to year 8. It is interesting to note that, at year 8, the number of students seeing “text bullying” as a not so good thing about cell phones rose from 8% in 2004 to 23% in 2008. There was little change overall from 2004, and modest gender differences favouring girls.
|