|
||||||||||
|
|||||||||||
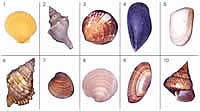
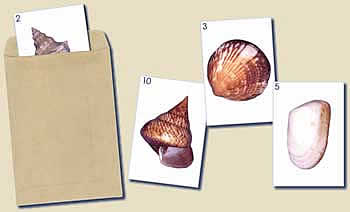
Questions/instructions:
|
|||||||||||
| %
responses 2006 ('02) |
|||||||||||
| y4 |
y8
|
||||||||||
| Group members guessed the shell described? |
all other students guessed the right shell |
34 (18) |
53 (51) |
||||||||
yes, but no consensus (at least one other student guessed right shell) |
50 (57) |
39 (37) |
|||||||||
no |
16 (25) |
8 (12) |
|||||||||
| Number of accurate clues/ descriptions given: |
5–12 |
34 (40) |
60 (61) |
||||||||
4 |
24 (28) |
23 (20) |
|||||||||
3 |
22 (19) |
11 (12) |
|||||||||
2 |
13 (7) |
5 (4) |
|||||||||
0–1 |
7 (6) |
1 (3) |
|||||||||
| Overall, shell was described: |
very well |
8 (5) |
38 (35) |
||||||||
well |
29 (39) |
37 (39) |
|||||||||
moderately well |
44 (33) |
18 (17) |
|||||||||
poorly |
19 (23) |
7 (9) |
|||||||||
Total
score: |
7 |
7 (5) |
34 (34) |
||||||||
6 |
17 (26) |
24 (24) |
|||||||||
5 |
18 (18) |
18 (16) |
|||||||||
3–4 |
35 (32) |
17 (16) |
|||||||||
0–2 |
23 (19) |
7 (10) |
|||||||||
| Subgroup Analysis: |
Year 4 |
||
Year 8 |
| Commentary: |
| About three quarters of the year 8 students described their shell well or very well (compared to half that proportion of year 4 students). There was no meaningful change in performance between 2002 and 2006. In general, girls performed better than boys at both year levels. |
|
|
||

