|
||||||||||||||||
|
||||||||||||||||
%
responses 2009 ('05) |
||||||||||||||||
y4 |
y8 |
|||||||||||||||
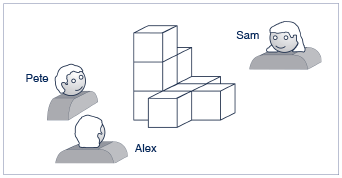
| 1.
Below are views of this building from different sides. Who would see
these views? |
||||||||||||||||
|
Alex
|
53 (54) | 84 (86) | |||||||||||||
|
Pete
|
52 (54) | 84 (86) | |||||||||||||
|
Sam | 57 (61) | 82 (85) | |||||||||||||
| YEAR 8 ONLY: | ||||||||||||||||
| 2. Draw what you would see if you were standing on the opposite side to Pete. | 63 (58) | |||||||||||||||
|
||||||||||||||||
| 3. Draw the view you would see if you looked down on it from a helicopter. | 63 (64) | |||||||||||||||
|
||||||||||||||||
| (or any rotation of this shape) | ||||||||||||||||
Y4
Total score: |
3
|
43 (43) | ||||||||||||||
| 2
|
0 (1) | |||||||||||||||
| 1
|
34 (37) | |||||||||||||||
| 0
|
23 (19) | |||||||||||||||
Y8
Total score: |
5
|
47
(46) |
||||||||||||||
| 4
|
18 (21) | |||||||||||||||
| 2–3
|
20 (20) | |||||||||||||||
| 0–1 | 15 (13) | |||||||||||||||


| Subgroup Analysis [Click on charts to enlarge] : |
Year 4 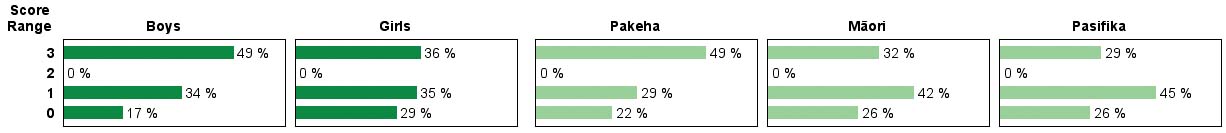 |
||
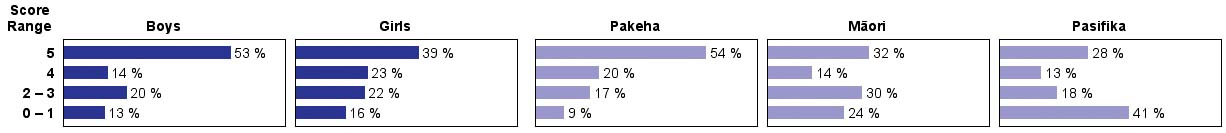
| Commentary: |
| About 20% fewer year 8 students were able to draw a view than to identify one. Performance was very similar in 2005 and 2009. Year 8 Mäori students and Pasifika students were, on average, substantially less successful than Pakeha students. Year 4 boys scored significantly higher than girls. |