|
||||||||||||||||
|
||||||||||||||||
%
responses 2009 ('05) |
||||||||||||||||
y4 |
y8 |
|||||||||||||||
| 1.
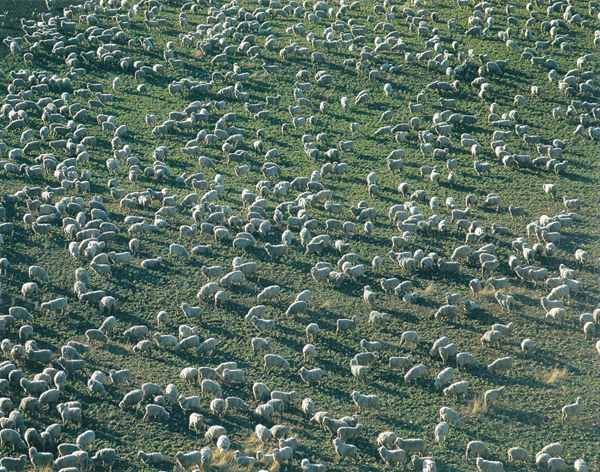
Which number do you think is nearest to the actual number of sheep?
Circle your choice. [Actual count: 810] |
||||||||||||||||
| a. | 50 sheep | 2 (3) | 1 (0) | |||||||||||||
| b. |
|
45 (53) | 65 (69) | |||||||||||||
| c. | 5000 sheep | 52 (44) | 32 (30) | |||||||||||||
Total
score: |
1 | 45 (53) | 65 (69) | |||||||||||||
| 0 | 55 (47) | 35 (31) | ||||||||||||||
| Subgroup Analysis [Click on charts to enlarge] : |
Year 4  |
||

| Commentary: |
| Students
showed quite limited skills at estimation, despite the large differences
between the answer choices. Performance declined a little between 2005 and 2009.
Mäori and Pakeha students performed very similarly at both year levels. |