|
|||||||||||||||||||||||||||||||
|
|||||||||||||||||||||||||||||||
%
responses 2009 ('05) |
|||||||||||||||||||||||||||||||
y4 |
y8 |
||||||||||||||||||||||||||||||
| 1.
Fill in the table to show how many times you think each number would
come up [Table 1]. Allow time. |
|||||||||||||||||||||||||||||||
| Predictions: | 49 (56) | ||||||||||||||||||||||||||||||
| prediction for each number was 5 | 42 (35) | ||||||||||||||||||||||||||||||
| any other response | 9 (9) | ||||||||||||||||||||||||||||||
| 2. Why do you think those numbers are reasonable? | |||||||||||||||||||||||||||||||
| Explanation: | 3 (3) | ||||||||||||||||||||||||||||||
| showed expectation of an even distribution from throws | 38 (34) | ||||||||||||||||||||||||||||||
| 3. If someone put down that 12 out of the 30 would be sixes, would that be unusual or surprising? | |||||||||||||||||||||||||||||||
| yes | 81 (70) | ||||||||||||||||||||||||||||||
| 4. Why do you say that? | |||||||||||||||||||||||||||||||
| Explanation: | 3 (3) | ||||||||||||||||||||||||||||||
| showed a clear understanding of variation in probability, and thought 12 out of 30 was a reasonable possibility | 4 (2) | ||||||||||||||||||||||||||||||
| showed an expectation that the distribution would be even | 13 (8) | ||||||||||||||||||||||||||||||
|
|||||||||||||||||||||||||||||||
| 5. Throw this die 30 times. Use this tally chart to record how often the numbers come up [Table 2]. | |||||||||||||||||||||||||||||||
| Allow time. Count the 30 throws for the student but don’t tally for them. | |||||||||||||||||||||||||||||||
| Used tally system: | yes, including clusters of five | 79 (73) | |||||||||||||||||||||||||||||
| yes, not including clusters of five | 18 (22) | ||||||||||||||||||||||||||||||
| Tallies totalled 30: | 76 (76) | ||||||||||||||||||||||||||||||
| 6. Why do you think there are differences between your predictions and what you actually got? | |||||||||||||||||||||||||||||||
| Explanation: | |||||||||||||||||||||||||||||||
| (extent
to which the explanation showed understanding of appropriate variation in probability) |
strong | 1 (1) | |||||||||||||||||||||||||||||
| moderate | 21 (23) | ||||||||||||||||||||||||||||||
| weak or no explanation | 78 (76) | ||||||||||||||||||||||||||||||
|
|
|||||||||||||||||||||||||||||||
Total
score: |
4–7 |
5 (4) | |||||||||||||||||||||||||||||
| 3
|
6 (9) | ||||||||||||||||||||||||||||||
| 2
|
48 (49) | ||||||||||||||||||||||||||||||
| 1
|
33 (21) | ||||||||||||||||||||||||||||||
| 0 | 8
(17) |
||||||||||||||||||||||||||||||
| Subgroup Analysis [Click on charts to enlarge] : |
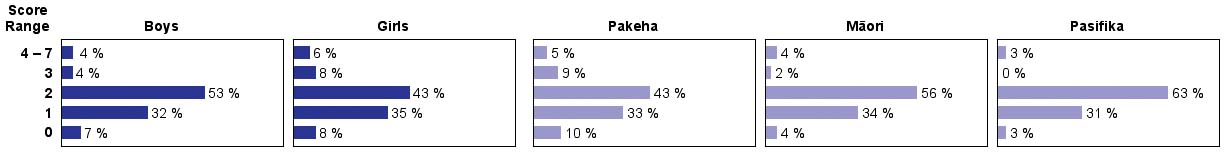
| Commentary: |
| The
total score centred on understanding of randomness and probability,
and few year 8 students performed well. All subgroups performed similarly. |