The graphs and figures that illustrate the derivation of a hierarchical cluster profile based on the B Sample tasks follow.
The initial cluster solution is illustrated below in Figure 15 shaded at the 5 cluster solution.
The heirarchical cluster solution was based upon the flexible cluster procedure with beta set to .25. Five cases were removed from the analysis as they became irreconcilable single case clusters due to the extent of missing data. The scree slope of the pseudo t statistic which led to the decision to utilise the five cluster solution is illustrated in Figure 16 below. The flattening out of the pseudo-t line past the 6 cluster point may be because the amalgamations between clusters past that point do not represent joinings between profoundly different clusters.
Some support for the five cluster solution is found in the visual depiction of cluster solutions in Figure 17 below. Coloured versions of the figure showed that in general there tended to be a higher colour density within clusters than between clusters. This is particularly evident for the densities between cluster 5 and the other three clusters. The structure evident in the truncated tree in Figure 17 emphasizes the difference between this cluster and the other four.
In terms of validation of the non-randomness of the cluster solution at 5 clusters shown in Figure 18, CLUSTAN GRAPHICS allowed the comparison of the series of fusion coefficients (distances) of the actual sample compared to a series of Bootstrap-derived samples. The results of this comparison is detailed in Figure 19 below. The largest deviations of the Bootstrap derived samples from the other samples between 4 and 6 clusters. Based upon these results, the decision to utilise the 5 cluster solution in further analysis has justification.
Analyses
to Validate and Explore the Emergent Clusters
![]() To understand the differences
between clusters, profiles of the average score percentage of the maximum
score were calculated for each cluster group. The resultant profiles are
illustrated in Figure 20 and Figure 21 below.
To understand the differences
between clusters, profiles of the average score percentage of the maximum
score were calculated for each cluster group. The resultant profiles are
illustrated in Figure 20 and Figure 21 below.
(Click on graphs to enlarge)
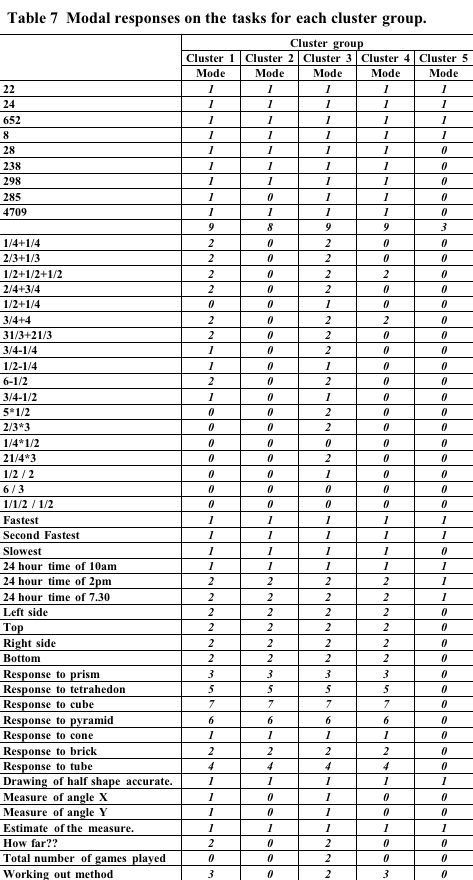
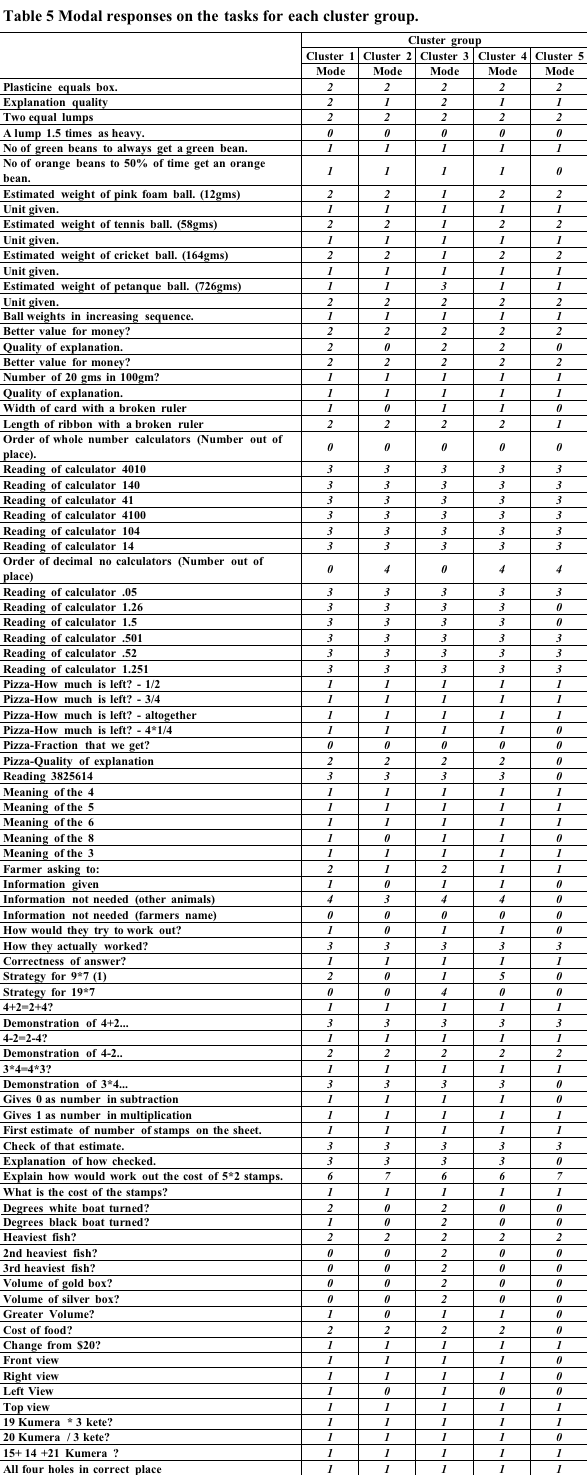
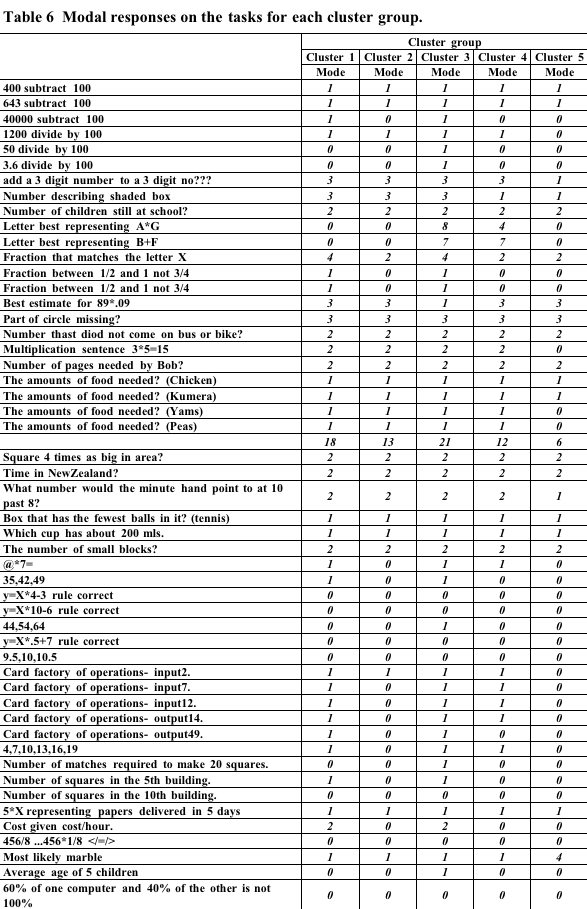
In order to look at the differences between profiles tables of the most common response to each task were prepared. These are shown Table 5, Table 6, Table 7 below.

Qualitative
Summary of cluster groups
![]() As well as the quantitative
analysis of scores and examination of modal responses a cross tabulation
of each task used in the analysis by the cluster groups was carried
out. The tables from these are found in Appendix VI. For most tasks
there was a significant chi-square statistic indicating non-chance differences
in the distributions of task responses between groups. A qualitative
summary of the cluster group profiles obtained by the cross tabulation
of Nemp task by cluster group follows.
As well as the quantitative
analysis of scores and examination of modal responses a cross tabulation
of each task used in the analysis by the cluster groups was carried
out. The tables from these are found in Appendix VI. For most tasks
there was a significant chi-square statistic indicating non-chance differences
in the distributions of task responses between groups. A qualitative
summary of the cluster group profiles obtained by the cross tabulation
of Nemp task by cluster group follows.
Cluster
group 5 had poorer performance on all tasks than other cluster groups.
Cluster group 3 tended to have better performance on all tasks
than any other cluster groups. This was profoundly the case for the
Better buy score, the Broken ruler score, the Calculator ordering score,
the Population score, the Boats score, the Fishing comp score, the Two
Boxes Score, the Algorithms score, the Algebra score, the Angles score
the How far score, and the Games score
Cluster groups 1 and 2 were quite differentiable from cluster
groups 3 and 4. The latter groups were higher in the Better buy
score, the Broken ruler score, the Boats score, the Fishing comp score,
the Jacks cows score, the Paper folds score, the Two Boxes Score, the
Algorithms score, the Algebra score, the Statistics score, the Video
score, the Angles score the How far score, and the Games score.
Examining the modal scores it was clear that cluster group 2
was less sophisticated than cluster group 1 especially in tasks
requiring application of fractional and algebraic knowledge.
Examining the modal scores it appeared that what differentiates cluster
groups 3 and 4 is the greater knowledge of algebraic formulation
(e.g. calculation of the volume of a box), and also the application
of such formulation (e.g working out how far a car will go with various
amounts of petrol).
Global
summary:
The results indicated distinct cluster groups with different competencies.
In terms of percentages those in the two most competent cluster groups
makes up approximately 38% of the sample. Another reasonably competent
cluster group makes up 20% of the sample. The remaining students in
the sample could be classified as having a number of deficits especially
in tasks requiring some degree of algebraic or ratio knowledge. (Unfortunately
these groups showed demographic chracteristics similar to the poor performing
groups in Sample A. See Appendix VII).
The cluster analysis proved to be of some value in differentiating groups
across all tasks. A more microgenetic level analysis of just the Algebra
task items will be reported in the next section.


