The initial cluster solution is illustrated below in Figure 27 shaded at the 4 cluster solution.

The heirarchical cluster solution was based upon the flexible cluster procedure with beta set to .25. A total of 28 cases were removed from the analysis as they were in danger of leading to irreconcilable single case clusters due to the extent of missing data. The scree slope of the pseudo t statistic which led to the decision to utilise the four cluster solution is illustrated in Figure 28 below. The flattening out of the pseudo-t line past the 5 cluster point may be because the amalgamations between clusters past that point do not represent joinings between profoundly different clusters.
Some
support for the four cluster solution is found in the visual depiction
of cluster solutions in Figure 29 below. Coloured versions of the figure
showed that in general there tended to be a higher colour density within
clusters than between clusters. This is particularly evident for the densities
between cluster 1 and the clusters 3 and 4. The structure evident in the
truncated tree in Figure 29 is consistent with a greater difference between
this cluster and clusters 3 and 4.
In terms of validation of the
non-randomness of the cluster solution at 4 clusters shown in Figure 30,
CLUSTAN GRAPHICS allowed the comparison of the series of fusion coefficients
(distances) of the actual sample compared to a series of Bootstrap-derived
samples. The results of this comparison is detailed in Figure 31 below.
The largest deviations of the Bootstrap derived samples from the other
samples between 3 and 5 clusters. Based upon these results, the decision
to utilise the 4 cluster solution in further analysis has justification.
Analyses to Validate and Explore the Emergent Clusters
![]() To
understand the differences between clusters, profiles of the average score
percentages of the maximum score for each were calculated for each cluster
group. The resultant profiles are illustrated in Figure 20 and Figure
21 below.
To
understand the differences between clusters, profiles of the average score
percentages of the maximum score for each were calculated for each cluster
group. The resultant profiles are illustrated in Figure 20 and Figure
21 below.
(Click figures to enlarge)
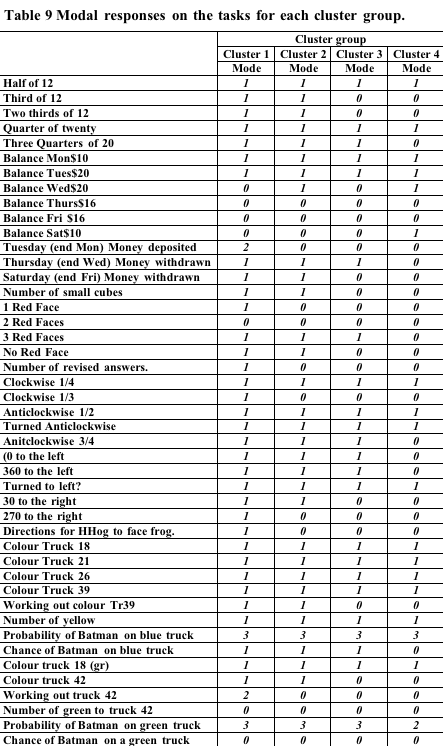
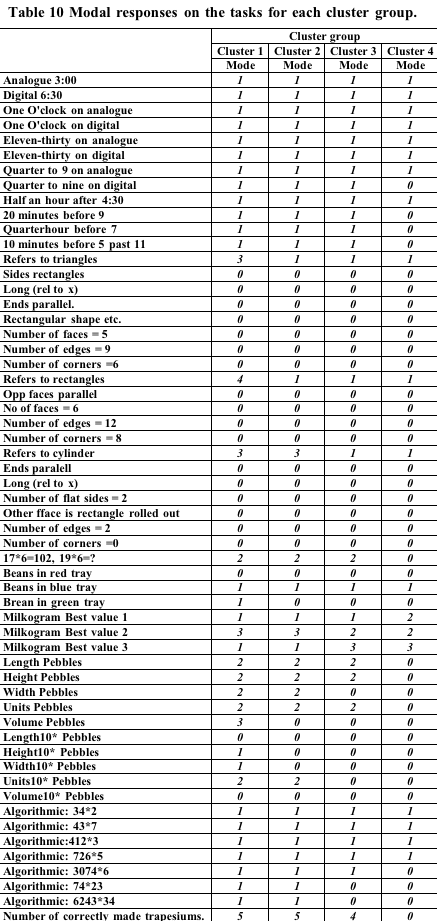
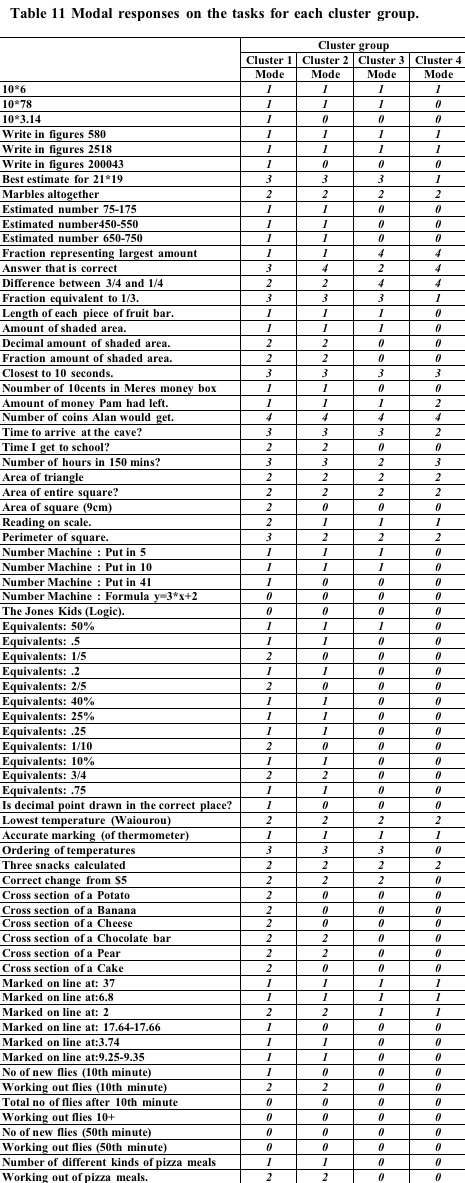
In order to look at
the differences between profiles tables of the most common response to
each task were prepared. These are shown Table 9, Table 10, Table 11 below.
Qualitative
Summary of cluster groups
![]() Cross
tabulation of each task by the cluster groups was carried out. The tables
from these analysis are found in Appendix IX. For most tasks there was
a significant chi-square statistic indicating non chance differences
in the distributions of task responses between groups. A qualitative
summary of the cluster group profiles obtained by examining cluster
profiles on the NEMP tasks score and the cross tabulation of each Nemp
task by cluster group follow.
Cross
tabulation of each task by the cluster groups was carried out. The tables
from these analysis are found in Appendix IX. For most tasks there was
a significant chi-square statistic indicating non chance differences
in the distributions of task responses between groups. A qualitative
summary of the cluster group profiles obtained by examining cluster
profiles on the NEMP tasks score and the cross tabulation of each Nemp
task by cluster group follow.
Cluster group 1 showed good understanding on most tasks. They
scored lowest on their ability to to solve problems involving algebraic
predictions of trends (for instance the flies task?”). They exhibited
lower scores on one of the geometry and one of the measurement tasks
but because both of these tasks were more open-ended requiring verbal
descriptions of the situation it is likely that the lower scores are
more reflective of task type, rather than difficulty with the task.
(Other groups also scored lower with these problems.) We might label
this group the uniformly proficient group.
Cluster group 2 was differentiable from cluster group 1 in having
lower performance on most tasks, but in particular they had greater
difficulties in restating numbers in equivalent forms (particularly
when the equivalent form required representation as a fraction). Consistent
with this they had difficulty in identifying where decimal points should
go on a calculator that had no point showing (after a division had occurred).
Their performance on cross-sectional geometry tasks was also poor relative
to group 1. We label this group the developing proficiency, poor
number representation group.
Cluster group 3 was distinguishable from cluster group 1 in the
same ways as cluster group 2 and in a number of other tasks. They did
poorly in the bears task (involving selecting a fraction of a complete
set). They did poorly in the milkogran problem involving ratio and in
obtaining the volume and volume dimensions of a number of pebbles packets.
Their performance was relatively poor on Measurement (involving computation
e.g. perimeter) the Algebra number machine task and in assigning numbers
to positions on number line sections. We might label this group the
poor number representation, algebraic difficulty group. We hesitate
to label this group as developing proficiency as it can be seen by inspection
of the tables in Appendix IX, that this group unlike the Cluster 2 group
often did not exhibit reasonable rudimentary strategies on a number
of the problems.
Cluster group 4 was distinguishable from the previous three groups
by poorer performance in almost all tasks. It performed at about the
same level as group three in a number of tasks, but could be distinguished
by the following task scores (and underlying strategies). The group
had difficulty with the simple problem of 19*6 given 17*6 (at least
in providing a strategy). It had a score approaching baseline on a number
of tasks including Trapesiums Money basics Measurement (involved comp)
Algebra (no machine etc) Equivalents basics Decimal Cross-sections Numbers
on lines Flies score (algebra) Pizza combinations. Strategies exhibited
were unsuccessful. We might label this group the basic mathematical
learning difficulty group.
Global summary
The first two of the cluster groups which emerged from this analysis
did not seem to be profoundly different and seemed to have developed
proficiency at being able to solve most of the NEMP type tasks. They
constituted a total of 285 out of the 471 cases which were accepted
for the analysis. Cluster group 3 made up of 105 students had lower
levels of performance than the other two and often utilized inadequate
strategies. Cluster group 4 comprised 81 (17%) of the sample and showed
poor performance across the range of tasks (the exception being in the
areas of understanding of time measurement conventions and recall of
division number facts). The latter cluster of students along with significant
numbers of the missing students and some students from Cluster 3 would
benefit from a programme that develops mathematical thinking in areas
other than basic arithmetic processes.
Once again there was evidence of the play of demographic factors in
performance (see Appendix XII).


