The graphs and figures that illustrate the derivation of a hierarchical cluster profile based on the cut cubes C Sample task follow.
The initial cluster solution is illustrated below in Figure 34 shaded at the 3 cluster solution.
The heirarchical cluster solution was based upon the flexible cluster procedure with beta set to .25. There were 20 cases removed from the analysis as they became an irreconcilable single case cluster due to the extent of missing data.: The scree slope of the pseudo t statistic which led to the decision to utilise the three cluster solution is illustrated in Figure 35 below. The flattening out of the pseudo-t line past the 4 cluster point may be because the amalgamations between clusters past that point do not represent joinings between profoundly different clusters.
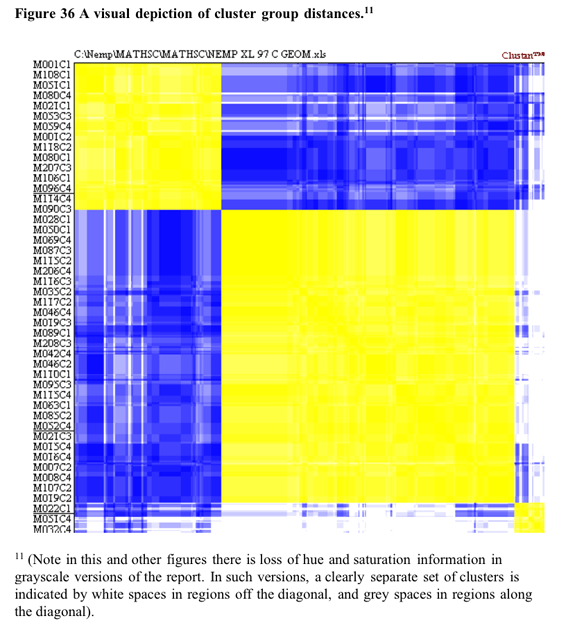
Some support for the three cluster solution is found in the visual depiction of cluster solutions in Figure 36 below. Coloured versions of the figure showed that for most cases tended to be only a marginally higher colour density within clusters than between clusters. This is not the case between the smaller cluster three and clusters one and two. [10]
[10] Note that low proximities between clusters are necessary but not sufficient conditions for “real” clusters. To be regarded as such, there must also be close proximities within clusters.
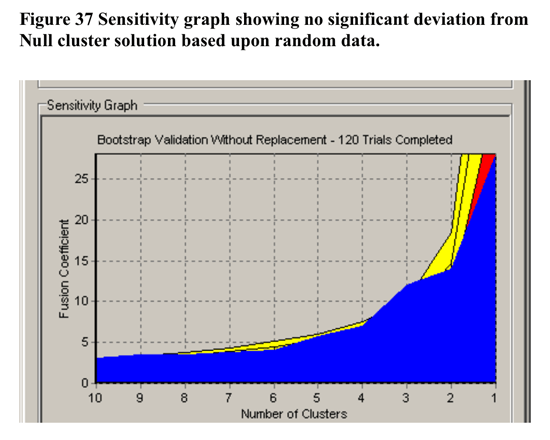
In terms of validation of the non-randomness of the cluster solution at 3 clusters, CLUSTAN GRAPHICS allowed the comparison of the series of fusion coefficients (distances) of the actual sample compared to a series of Bootstrap-derived samples. The results of this comparison is detailed in Figure 37 below. There was little evidence for any clustering beyond two clusters.
Qualitative
Summary of cluster groups![]() Cross
tabulation of each task by the three cluster groups was carried out
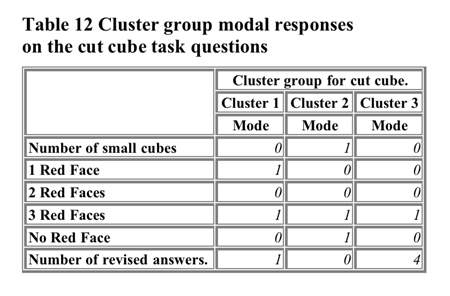
(see Appendix XIII). Table 12 shows the modal responses of the cluster
groups on the task questions.
Cross
tabulation of each task by the three cluster groups was carried out
(see Appendix XIII). Table 12 shows the modal responses of the cluster
groups on the task questions.
The
crosstabulation summary is to be found in the C appendices . For the
questions regarding the total number of cubes, number of cubes with
one red face, and the number of cubes with three red faces there was
a significant chi-square statistic indicating non chance differences
in the distributions of task responses between groups. A qualitative
summary of the cluster group profiles obtained by the cross tabulation
of the each Nemp task by cluster group follows:
Cluster group 1 showed 50% correct performance on the numbers
of cubes with 1 and no red faces. They showed above 60% performance
on the number of cubes with 3 red faces. They were poor at the total
number of cubes and with the number of cubes with 2 red face. We might
label this group the focus on surface and deep large cube layout
cluster group.
Cluster group 2 showed 50% correct performance on the total number
of cubes and the numbers of cubes with 3 red faces and no red faces.
They showed poor performance at the 1 and 2 red faces red faces question.
We might label this group the focus on small cube elements as entities
cluster group (as the best performances appear to be on those tasks
requiring counting or imagining "whole" entities).
Cluster group 3 showed just under 50% correct performance on the
number of cubes with 1 red face. They showed 60% performance on the
number of cubes with 3 red faces. They were poor at the remaining cube
questions. They were also notably more inclined to revise their answers
than the other two cluster We might label this group the focus on
surface large cube layout cluster group.
Global
summary
The three cluster solution while questionable in terms of validation
via bootstrap resampling does prove to discriminate groups on certain
tasks. Accordingly an attempt was made to interpret the emergent cluster
groups. There appears to be patterns in the data that suggest some students
can be characterised as inclined to approach the cube task "top
down" - that is with reference to the features of the larger entity.
The converse cluster group can be characterised as processing the cube
via an enumeration (quantitatively and spatially) of its individual
elements.


