| ACKNOWLEDGEMENTS |
 |
The Project
directors acknowledge the vital support and contributions of many people
to this report, including:
• the very dedicated staff of the Educational Assessment Research Unit
• Heleen Visser, Hadyn Green, Nicola Durling and other staff members of the Ministry of Education
• members of the Project’s National Advisory Committee
• members of the Project’s Science Advisory Panel
• principals and children of the schools where tasks were trialled
• principals, staff and Board of Trustee members of the 248 schools included in the 2007 sample
• the 2877 children who participated in the assessments and their parents
• the 96 teachers who administered the assessments to the children
• the 44 senior tertiary students who assisted with the marking process
• the 170 teachers who assisted with the marking of tasks early in 2008.
| The NEMP Approach to National Monitoring |
 |
New Zealand’s National Education Monitoring Project commenced in 1993, with the task of assessing and reporting on the achievement of New Zealand primary school children in all areas of the school curriculum. Children are assessed at two class levels: year 4 (halfway through primary education) and year 8 (at the end of primary education). Different curriculum areas and skills are assessed each year, over a four-year cycle. The main goal of national monitoring is to provide detailed information about what children know, think and can do, so that patterns of performance can be recognised, successes celebrated, and desirable changes to educational practices and resources identified and implemented.
Each year, random samples of children are selected nationally, then assessed in their own schools by teachers specially seconded and trained for this work. Task instructions are given orally by teachers, through video presentations, on laptop computers, or in writing. Many of the assessment tasks involve the children in the use of equipment and materials. Their responses are presented orally, by demonstration, in writing, in computer files, or through other physical products. Many of the responses are recorded on videotape for subsequent analysis.
The use of many tasks with both year 4 and year 8 students allows comparisons of the performance of year 4 and 8 students in 2007. Because some tasks have been used twice, in 2003 and again in 2007, trends in performance across the four-year period can also be analysed and reported.
| Assessing Science |
 |
In 2007, the first year of the fourth cycle of national monitoring, three areas were assessed: science, art, and the use of graphs, tables and maps. This report presents details and results of the assessments in science.
The aims of a science education include the development of knowledge and understanding, skills of scientific investigation, and attitudes on which such investigation depends.
A framework for science education and its assessment is presented in Chapter 2. This framework highlights the four main content strands of the science curriculum (the living world, physical world, material world, and planet Earth and beyond) and also indicates important scientific approaches, skills and attitudes.
|
|
| Most students responded with considerable enthusiasm to tasks involving hands-on experimentation, as individuals or as teams. Their enthusiasm for tasks exploring knowledge and understanding of scientific phenomena and concepts was lower on average, but varied considerably depending on the particular task. |
| Living World |
 |
Chapter 3 examines achievement relating to the living world curriculum strand.
|
|
 |
Munchies
[Creagh, C., Milner, A. (ed.) (1995). Dinosaurs; Sydney: Allen & Unwin.]
|
|
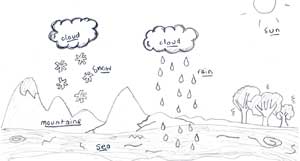
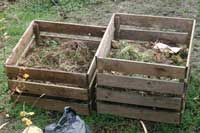
Averaged across 249 task components used with both year 4 and year 8 students, 10% more year 8 than year 4 students produced correct or good responses. This indicates that, on average, students have made useful progress between year 4 and year 8 in the skills assessed by the tasks. Not surprisingly, students at both levels were less successful in providing explanations for living world phenomena than in demonstrating their knowledge of the phenomena or their ability to classify and identify observable features of specific phenomena.
Year 8 students generally were substantially better than year 4 students at offering explanations, but the advantage was smaller on components focused on identification, classification and knowledge.
|
Nine trend tasks involving a total of 94 components were administered to year 4 students in both the 2003 and 2007 assessments. Averaged across these components, 1% fewer students succeeded in 2007 than in 2003. This difference is not important. Ten trend tasks involving 114 task components were administered to year 8 students in both assessments. Averaged across these components, 1% fewer students succeeded in 2007 than 2003. This difference clearly is not important. |
| Physical World |
|
 |
Chapter 4 examines achievement relating to the physical world curriculum strand.
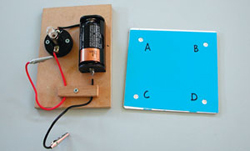
Averaged across 69 task components used with both year 4 and year 8 students, 13% more year 8 than year 4 students produced correct or good responses. This indicates that, on average, students have made quite substantial progress between year 4 and year 8 in the skills assessed by the tasks. The largest gains generally occurred for task components requiring explanations of physical world phenomena, and the lowest gains for task components requiring accurate experimentation, observation and reporting.
Seven trend tasks involving a total of 40 components were administered to year 4 students in both the 2003 and 2007 assessments. Averaged across these components, 3% fewer students succeeded in 2007 than in 2003. This is a small |
|
| but noteworthy difference, especially because there was an identical (3%) decline in performance between 1999 and 2003. The same seven trend tasks were administered to year 8 students in both assessments. Averaged across the 40 components, 1% fewer students succeeded in 2007 than 2003. This difference is not important, although it matches a similar 1% decline between 1999 and 2003. |
| Material World |
 |
|
Chapter 5 reports achievement relating to the material world curriculum strand.
Averaged across 101 task components used with both year 4 and year 8 students, 14% more year 8 than year 4 students produced correct or good responses. This indicates that, on average, students have made quite substantial progress between year 4 and year 8 in the skills assessed by the tasks. The largest gains generally occurred for task components requiring explanations of material world phenomena, and the lowest gains for task components requiring accurate experimentation, observation and reporting.
|
| Six trend tasks involving a total of 60 components were administered to year 4 students in both the 2003 and 2007 assessments. Averaged across these components, 3% fewer students succeeded in 2007 than in 2003. Considered alongside the 2% decline between 1999 and 2003, this small difference becomes noteworthy. The same six trend tasks were administered to year 8 students in both assessments. Averaged across the 60 components, the same percentage of students succeeded in 2007 as in 2003. |
| |
| Planet Earth and Beyond |
 |
Chapter 6 examines achievement relating to the planet Earth and beyond curriculum strand.
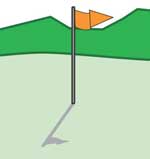
Averaged across 133 task components used with both year 4 and year 8 students, 11% more year 8 than year 4 students produced correct or good responses. This indicates that, on average, students have made useful progress between year 4 and year 8 in the skills assessed by the tasks.
Four trend tasks involving a total of 46 components were administered to year 4 students in both the 2003 and 2007 assessments. Averaged across the 46 components, 2% fewer students succeeded in 2007 than in 2003. This is a very small difference. Between 1999 and 2003 there had been no change. Six trend tasks involving 60 task components were administered to year 8 students in both assessments. Averaged across these components, 2% fewer students succeeded in 2007 than in 2003. This is a very small difference. Between 1999 and 2003 there had been a 3% increase for this strand.
|
|
| |
| Survey |
 |
Chapter 7 presents the results of the science surveys, which sought information from students about their curriculum preferences and their perceptions of their achievement and potential in science. Students were also asked about their involvement in science-related activities within school and beyond.
Students were asked to indicate their first three preferences from a list of six class science activities. Two activities (“doing things like experiments” and “going on field trips”) were strong first preferences at both year levels, with year 4 regarding both similarly and year 8 strongly favouring experiments.
Year 4 students were generally very positive about doing science at school. Almost two thirds chose the highest rating for the first question (about liking to do science at school), and 71% would like to do more science at school. Over half wanted to keep learning about science when they grew up, and about a quarter thought they would make good scientists when they grew up. The year 4 students were less confident that they learned a lot of science at school, with 24% saying that they learned “heaps” and only 12% saying that their class did really good things in science “heaps”. The proportion of students who felt they had very limited opportunities to learn science has increased over the last eight years: 16% said that they learned “very little” in science at school (compared to 8% in 1999), 15% said they “never” did really good things in science at school (compared to 5% in 1999), and there were increased percentages saying that they “never” did the following things in science at school: experiments with science equipment, experiments with everyday things, research or projects, and visits to science activities. These responses suggest that much science in school is bookwork, with practical work, field trips, visits and experiments less common. In a question introduced for the first time in the 2007 survey, it is a concern that 32% of year 4 students marked “don’t know” in response to “How good does your teacher think that you are at doing science”.
|
Compared to year 4 students, year 8 students were less inclined to use the most positive categories. This pattern has been common in national monitoring surveys. Older students can be expected to be more discerning and critical, as well as more realistic about their own abilities. However, trends across time paralleled those already mentioned for year 4 students. Almost half of the year 8 students would like more science at school. The percentage of year 8 students particularly enjoying science at school dropped from 37% to 24% over eight years, while the percentage with a negative view increased from 15% to 37%. Sixteen percent (compared to 8% in 1999) indicated that their class “never” did really good things in science. There were similar increases in the percentages indicating that they “never” did experiments with everyday things or with science equipment. Only 5% indicated that they thought they would be a good scientist when they grew up, while 38% said that they “didn’t know” how good their teacher thought they were at doing science.
|
| Performance of Subgroups |
 |
School type (full primary, intermediate, or year 7 to 13 high school), school size, community size and geographic zone were not important factors predicting achievement on the science tasks. This was also true in the 2003, 1999 and 1995 science assessments.
There were statistically significant differences in the performance of students from low, medium and high decile schools on 67% of the tasks at year 4 level (compared to 65% in 2003, 54% in 1999, and 54% in 1995). At year 8 level there were statistically significant differences on 74% of the tasks (compared to 65% in 2003, 63% in 1999, and 56% in 1995). Over the 12 years from 1995 to 2007, there has been a modest increase in disparities of achievement among students from schools at different decile levels.
For the comparisons of boys with girls, Pakeha with Mäori, Pakeha with Pasifika students, and students for whom the predominant language at home was English with those for whom it was not, effect sizes were used. Effect size is the difference in mean (average) performance of the two groups, divided by the pooled standard deviation of the scores on the particular task. For this summary, these effect sizes were averaged across all tasks.
Year 4 boys averaged slightly higher than girls, with a mean effect size of 0.04 (boys averaged 0.04 standard deviations higher than girls). The advantage for year 4 boys has decreased slightly since 1999, from mean effect sizes of 0.08 in 2003 and 0.15 in 1999. Year 8 boys also averaged slightly higher than girls, with a mean effect size of 0.09 (exactly the same as in 2003, and slightly lower than the mean effect size of 0.14 in 1999).
Pakeha students averaged moderately higher than Mäori students, with mean effect sizes of 0.30 for year 4 students and 0.37 for year 8 students. These mean effect sizes are identical at both year levels to the 2003 results, and very slightly higher than the corresponding figures in 1999 (0.27 for year 4 students, 0.34 for year 8 students).
|
Pakeha students averaged substan-tially higher than Pasifika students, with mean effect sizes of 0.58 for year 4 students and 0.59 for year 8 students. At both year levels, these show very little change from the corresponding results in 2003 and 1999 (0.57 in 2003 and 0.56 in 1999 for year 4 students, and 0.62 in 2003 and 0.55 in 1999 for year 8 students).
A noteworthy feature of the results for Mäori and Pasifika students is that they performed most similarly to Pakeha students on tasks that involved practical work (tasks emphasising accurate experimentation, observation and reporting) and tasks that used the team approach. Because a high proportion of these tasks were in the physical world strand (Chapter 4), the smallest mean effect sizes were for this area. In contrast, tasks in the living world strand (Chapter 3) and planet Earth and beyond strand (Chapter 6) predominantly involved knowledge and had the largest gaps in performance between Pakeha students and their Mäori or Pasifika counterparts.
Compared to students for whom the predominant language at home was English, students from homes where other languages predominated performed moderately less well at both year levels (both the year 4 and year 8 mean effect sizes were 0.25). These are lower than the corresponding mean effect sizes in 2003 (0.37 for year 4 students and 0.31 for year 8 students). Comparative figures are not available from the assessments in 1999.
|
| Summary of Performance Trends |
 |
An indication of overall trends in performance across the four-year period between 2003 and 2007 can be obtained by looking at the patterns of change across the trend tasks for all four of the curriculum strands. Averaged across 240 components of the year 4 trend tasks, 2% fewer students succeeded in 2007 than in 2003. Averaged across 274 components of the year 8 trend tasks, 1% fewer students succeeded in 2007 than in 2003.
The 2003 science report reported trends between 1999 and 2003, with an average decline over that four-year period of 1% on year 4 trend task components, and a gain of 2% on year 8 trend task components.
The 1999 science report reported trends between 1995 and 1999, with an average gain over that four-year period of 1% on year 4 trend task components, but no change on year 8 trend task components.
|
Taken together, these three sets of trend results suggest little change in science performance overall, for either year 4 or year 8 students, for the 12 year period from 1995 to 2007. However, a more detailed look suggests some concern for year 4 students. In the two assessment cycles since 1999, the performance of year 4 students on trend tasks has dropped twice by 3% in the physical world strand, by 2% and then 3% in the material world strand, and by an average of 1% per cycle in the other two strands. The significant declines for year 4 students in the physical and material world strands, which on average included tasks that were very popular with students, may be related to the evidence from the 2007 science survey that year 4 students were sensing a lack of science activities at school, and particularly a lack of “really good things” such as experiments and research/projects. This may reflect, in particular, diminished time spent on science related to the physical and material worlds.
|
|
