|
FOCUS / FORUM
INDEX
|
 |
In 2008, the Forum Comment,
was relaunched as the Focus
reflecting the closer comment from
NEMP and the panel of educators. |
|
|
Main Index for Focus / Forum
Introduction
to Focus / Forum
He
Whakaputanga Whakaaro –
Introduction for Mäori
Medium forums
|
| Forums by year of assessment |
|
|
|
Science
Art
Graphs, Tables & Maps
|
|
|
|
Music
Aspects of Technology
Reading & Speaking |
|
|
|
Information
Skills
Social Studies
Mathematics |
|
 |
|
Listening
& Viewing
Health & Phys. Ed.
Writing |
|
| Forums for Mäori Medium |
|
|
|
Science
Art
Graphs, Tables & Maps
|
|
|
|
Music
Aspects of Technology
Reading & Speaking |
|
|
|
Information
Skills
Social Studies
Mathematics |
|
|
|
Listening
& Viewing
Health & Phys. Ed.
Writing |
|
|
|
|
|
 |
|
 |
|
CLICK
on reports above to go directly
to comments |
|
2008
FORUM
PARTICIPANTS
Jan Adams
Susan Apathy
Robyn Baker
Denis Burchill
Alison Gilmore
Hadyn Green
Julie Hepburn
Mary Hill
Adi Leng
John Longbottom
Bill MacIntyre
Frances Neill
Bill Noble
Liz Patara
Graham Price
Geraldine Ryan
Ross Scrymgeour
Phebe Sorenson
Kate Vaughan
Marilyn Webb |
 Click
the Access Task icon for more information
about the tasks which will be available
to schools from November 2008.
Click
the Access Task icon for more information
about the tasks which will be available
to schools from November 2008. |
|
What did we find in
this year’s
NEMP results?
|
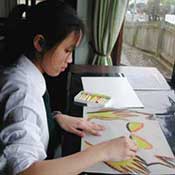
| Visual Arts |
 |
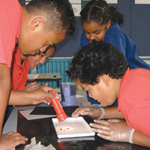
Science |
|
Graphs, Tables, Maps |
“The visual arts remain very popular for New Zealand students…
Mäori and Pasifika students were particularly enthusiastic.” |
“The percentage of year 8 students disliking science at school increased substantially, from 15% in 1999 to 37%
in 2007.” |
“There was substantial progress between year 4 and year 8 both in the ability to interpret graphs, tables and maps, and in the ability to construct them.” |
This year’s Focus (previously Forum Comment) reports on what we learned and what panels of leading New Zealand educators think the implications are.
The three reports on the 2007 assessment results were considered by a national forum of teachers, subject specialists, representatives of national organisations and government agencies. The forum has translated the findings into specific recommendations for educators working with primary school children.
|
|
|
 CLICK for
full report CLICK for
full report
|
GOOD
NEWS
• There was clear improvement from year 4 to year 8 in most aspects of science assessed, with particularly large gains in providing satisfactory explanations of scientific phenomena. Gains usually were larger for material world and physical world tasks than for tasks in the other strands. These patterns applied to boys and girls, and to Pakeha, Mäori and Pasifika students. |
|
| |
• Most students very much enjoyed tasks that allowed them to observe scientific phenomena occurring, through video recordings or practical activities, and were able to describe accurately what they had observed.
• Most students showed concern about environmental issues and risks. Not surprisingly, they were more aware of direct dangers from predators, resulting in death, injuries or other damage, than more indirect effects such as the dangers associated with systematic habitat change.
• Out of 14 subjects listed, science was the fourth most popular for year 4 students, little changed from 1999. It was sixth most popular subject for year 8 students. |
|
• Responses to the science survey indicate that about two-thirds of year 4 students are very positive about doing science at school; about half are very positive about “doing science things in their own time”, and about a quarter think they would “make a good scientist when they grow up”.
• Boys and girls performed similarly on most tasks at both year levels.
• Pakeha, Mäori and Pasifika students performed similarly well when tasks were not mainly based on prior knowledge. These tended to be practical tasks in the physical and material worlds that centred on experimentation and direct observation. |
|
|
CONCERNS
• There were some negative trends in responses to the science survey which gave cause for concern. The percentage of year 8 students disliking science at school increased substantially (from 15% in 1999 to 37% in 2007). The percentages of year 4 and year 8 students saying they think they learn “little” about science at school also increased between 1999 and 2007 (from 8 to 16% for year 4 students and 6 to 11% for year 8 students). Similarly, the percentages saying that their class “never” does really good things in science increased from 1999 to 2007 (from 5 to 15% for year 4 students and 8 to 16% for year 8 students).
• These trends in students’ attitudes and perceptions of the value of their school science programme may partly be explained by their reports of what school science involves. From 1999 to 2007, more students at both year levels indicated that their class “never” did experiments with everyday things, experiments with science equipment, or visited science activities. Science may be getting less attention because of increased demands from other curriculum areas, but it also appears that there has been a particular decline in the science activities that students find most stimulating. After each NEMP assessment session, students complete a survey indicating how much they enjoyed each of the tasks. On average, 82.5% of the year 8 students in 2007 indicated that they particularly enjoyed the 26 tasks that involved experimentation or other practical work, whereas many fewer (52%) indicated that they particularly enjoyed the 40 tasks that did not involve such activities.
• On average, there were small but clear declines in performance from 2003 to 2007 for year 4 students on both physical world tasks and material world tasks. The significance of this increases when it is noted that there were comparable declines in these two strands between 1999 and 2003. There is less reason for concern in regard to the other two strands for year 4 students, or any of the strands for year 8 students.
• Although on every task at both year levels there were Mäori and Pasifika students who performed very well, on average Mäori students performed moderately less well and Pasifika students substantially less well than Pakeha students. Performance differences typically were small for tasks that mainly centred on practical work (accurate experimentation, observation and reporting) and for tasks that were completed by teams of students; differences were larger, however, when tasks mainly required factual knowledge and explanations of phenomena. These achievement patterns have changed very little since the 1995 science assessments.
• At both year 4 and year 8, students from low decile schools performed worse than students from high decile schools on about two-thirds of the tasks, a slightly higher proportion than in the 1995 assessments.
|
 LOOKING
AHEAD LOOKING
AHEAD
• Engage students with science activities that resonate with their lives and interests. Most practical tasks fall into this category, as do activities that help students develop and demonstrate understanding of things they commonly experience,
e.g. Jelly Crystals task.
• Ensure that science programmes include activities in the physical and material worlds. These offer many opportunities for practical investigations, e.g. Magnetic Filings task.
• Provide frequent opportunities for students to give and justify explanations of science phenomena, and model for them the process of moving from observations to explanations, e.g. Cleaning Up task.
• Provide experiences that allow students to develop the ability to ask good investigative questions. Extended investigations are especially good for this purpose, and give students experiences of science in action, e.g. Wasps task.
 • Consider using some of the NEMP activities as springboards for more extended investigations, e.g. Way Out There task. • Consider using some of the NEMP activities as springboards for more extended investigations, e.g. Way Out There task.
• Ensure that students receive feedback about their progress in science and suggestions for how to progress.
• Consider using survey questions like those in the NEMP science survey to find out how students feel about what they are doing in science.
|
| |
| |
|
|
|
 CLICK for
full report CLICK for
full report
|
GOOD
NEWS
• The visual arts remain very popular for New Zealand students. Out of 14 subjects listed, visual arts ranked behind only physical education for year 4 students and was third for year 8 students (behind physical education and technology). About three-quarters of year 4 students and half of year 8 students were very positive about doing art at school, and about 60% of year 4 students and 30% of year 8 students were also very positive about doing art at home. Mäori and Pasifika students were particularly enthusiastic. |
|
|
• About 70% of year 4 students and 50% of year 8 students reported that they did “heaps” or “quite a lot” of art at school. Similar percentages would “like to do more”.
• Year 8 students performed better than year 4 students on art-making tasks, and on tasks involving responding to art that called for explanations and understandings.
• Both in art-making and responding to art, students performed as well in 2007 as in 2003, with suggestions of a small gain for year 8 students.
• Most students performed well on tasks that called for personal reactions and opinions, with year 4 students often doing as well as year 8 students.
• Year 4 students’ responses indicated that they did more drawing and computer art activities in school in 2007 than in previous years.
|
|
• Students typically performed somewhat better on art-making tasks that allowed them to look at their efforts and then modify them (such as clay modelling, computer drawing and collage).
• At both year levels, boys and girls performed similarly on tasks involving responding to art, while girls generally did slightly better than boys on art-making tasks.
|
|
|
CONCERNS
• Student performance in the visual arts did not match up with the enthusiasm that the students held for the subject. Tasks involving art making produced consistently low scores at year 4, with very few overall ratings (2% to 6%) in the “very good” to “excellent” range. Year 8 students did better, with 10% to 20% in the same range.
• In art-making tasks, skills in using the medium involved in the task (e.g. working with clay) and in including appropriate finer details generally scored lower marks than for expressiveness and composition.
• The results suggest that many students appeared to have had limited experience in responding to art. They did not perform well when asked for explanations.
• Many students at both year levels reported that they had little or no opportunity to engage in some types of art-making. Clay modelling, photography, construction, printmaking, carving, and working with fabrics/weaving were areas where large numbers of children (between 40% and 70%) reported never getting to do these things at school. These percentages have increased since 1999 for clay modelling, construction, printmaking, and working with fabrics/weaving.
• For year 8 students, group art-making activities in school appeared to be less common in 2007 than in 2003 or 1999. Just 25% of the 2007 students reported experiencing group art making “heaps” or “quite a lot”, compared to about 50% in both 2003 and 1999.
• Although students from all ethnic groups received marks in the highest and lowest score categories on all tasks, on average, Pakeha students performed better than Mäori students, with Pasifika students a little lower again. The differences were larger at year 4 than year 8, and larger for tasks involving responding to art than for art-making tasks. Differences are also larger on tasks having a strong language component. It should be noted that there are strong relationships between performance and socio-economic status (decile ratings of schools), and that it is difficult to disentangle the relative effects of ethnicity and socio-economic status.
• Over the 12-year span of NEMP assessments in the visual arts, the relationship between school decile and performance on tasks has increased considerably for year 4 students (students in higher decile schools receiving higher marks). There is not a consistent trend for year 8 students. |
LOOKING
AHEAD
• Recognise that the quality of and resources for students’ art education are strongly dependent on the commitment and support of the school’s leadership.
• Ensure opportunities, by providing sufficient and regularly timetabled time, for both making and responding to art in both two-dimensional media, such as drawing and painting, and three dimensional media, such as clay modelling and construction.
 |
• Give students regular opportunities for reviewing work in progress in order to deepen skills, clarify intentions, and increase language use in art contexts, e.g. Clay Person task.
|
• Increase group experiences in art to help enrich the development of ideas, language and team collaboration,
e.g. Pair Trees task.
• Ensure that rich art ideas and skills development are given prominence when the visual arts are incorporated into integrated learning programmes.
• Recognise that the results and examples shown in NEMP reports are the product of student work that did not involve direct instruction or teacher assistance. When teachers are guiding student art making, they should expect work to be more similar to the high-end examplars included in the report.
|
|
GRAPHS, TABLES & MAPS 2007 |
 |
 CLICK for
full report CLICK for
full report
|
GOOD
NEWS
• Year 4 and year 8 students show a basic ability to read and interpret graphs, tables and maps, with year 8 students showing marked improvement over year 4 students. There was substantial progress between year 4 and year 8 both in the ability to interpret graphs, tables and maps, and in the ability to construct them. The margin was twice as large for the more sophisticated task of constructing graphs, tables and maps, where the additional teaching received by the year 8 students appeared to help considerably.
|
 |
• Most year 4 and year 8 students performed well where tasks involved extracting information that was directly available from the graph, table or map. Where two or more different pieces of information were to be found and compared, especially if computation or more complex interpretation was needed, most year 8 students maintained quite strong performance, but most year 4 students were distinctly less successful.
• Students at year 4 and year 8 do particularly well in reading simple maps, bar graphs, Venn diagrams and pictographs where all relevant information is explicit. |
|
|
CONCERNS
• A large proportion of students at both year levels did not provide appropriate titles for graphs and labels for axes. They did not appear to understand the importance of these features for making the graphs interpretable.
• At both year levels, many students had difficulty constructing an appropriate graph or table if they were not given explicit instructions as to what the display should look like. They performed much better when given an appropriate model, or if they simply had to fill in additional details to a graph or table.
• In interpreting more complex graphs, students at both year levels often missed important details such as units or labels on axes.
• Year 8 student performance, both in interpreting and constructing graphs, tables and maps has shown a marginal, although consistent, decline since 1995.
• On all tasks, there were Mäori and Pasifika students who performed very well. However, on average, Mäori and Pasifika students performed less well than Pakeha students. Similar achievement patterns were evident in the 1999 and 2003 assessments.
• At both year 4 and year 8, students from low decile schools performed worse than students from high decile schools on about three quarters of the tasks, a slightly higher proportion than in the 1995 assessments. |
LOOKING
AHEAD
• As children master simple graphs, tables and maps, it would be constructive for teachers to focus on deeper features such as interpreting data, looking for trends, and constructing a graph based on a tally chart or verbal information,
e.g. Animal Add Ups task.
• Real contexts are useful for advancing children’s interpretation and construction of graphs, tables and maps. Examples of these are bus timetables, local information and websites that are familiar and relevant, e.g. TV Watching task.
• Students would gain from working with and discussing a wide variety of graphs, tables and maps, and exploring their purposes.
• In constructing a table or graph, students need to know that details such as labels matter, e.g. Baking task.
• Students would benefit from activities that collect, organize, and interpret data, e.g.Counting Counters task |
|
|
|
ISSN 1174-247X
|
|
|
|