|
FOCUS / FORUM
INDEX
|
 |
In 2008, the Forum Comment,
was relaunched as the Focus
reflecting the closer comment from
NEMP and the panel of educators. |
 |
|
Main Index for Focus / Forum
Introduction
to Focus / Forum
He
Whakaputanga Whakaaro –
Introduction for Mäori
Medium forums
|
| Forums by year of assessment |
|
|
|
Science
Art
Graphs, Tables & Maps
|
|
|
|
Music
Aspects of Technology
Reading & Speaking |
|
|
|
Information
Skills
Social Studies
Mathematics |
|
 |
|
Listening
& Viewing
Health & Phys. Ed.
Writing |
|
| Forums for Mäori Medium |
|
|
|
Science
Art
Graphs, Tables & Maps
|
|
|
|
Music
Aspects of Technology
Reading & Speaking |
|
|
|
Information
Skills
Social Studies
Mathematics |
|
 |
|
Listening
& Viewing
Health & Phys. Ed.
Writing |
|
|
|
|
|
 |
|
 |
|
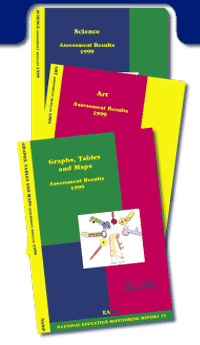
CLICK
on reports above to go directly
to comments |

Click
the Access Task icon for more information about
those tasks which are available to schools.
|
|
FORUM
PARTICIPANTS
Sandie Aikin
Raewyn Alexander
Dale Anderson
Audrey Banks
Julie Bourgeois
Wendy Brooks
Denis Burchill
Mary Chamberlain
Tricia Chapman
Fiona Coe
Peter Corrigan
Amanda Coulston
Bronwen Cowie
Cedric Croft
Terry Crooks
Pauline Donaldson
Alice Durbridge
Liz Eley
Warwick Elley
Val Fergusson
Lester Flockton
Alison Gilmore
Roger Hardie
Kerry Harvey
Lesley Hirst
Joe Hunter
Frances Kelly
Sarah Loftus
John Longbottom
Rob MacGregor
Lola MacKinnon
Ro Parsons
Liz Patara
Janet Pereira
David Philips
Graham Price
Deb Struthers
Barry Symon
Gloria Takuira
Mike Tilyard
Ani Wainui |
|
The
second four-year cycle of national monitoring started
in 1999. The second cycle marked the beginning of monitoring
and reporting achievement trends over four yearly intervals.
Results from this second cycle allowed comparisons with
performances in the previous cycle of assessments.
The three reports on the 1999 assessment results were considered
by a national forum of curriculum and assessment specialists,
principals, teachers, advisers and representatives of national
educational organisations. Their comments highlighted what
students generally were doing well, and those areas where
improvements were desirable.
The help
of principals, teachers and Boards of Trustees in making
NEMP reports and related Forum Comments widely
known is encouraged and appreciated.

|
|
|
 CLICK for
full report CLICK for
full report
|
GOOD
NEWS
• Students were able to respond appropriately
to a wide variety of tasks.
• There is substantial improvement in achievement
from year 4 to year 8 in all strands, particularly
on Material World tasks. This coincides with the
introduction in 1997 of the support document Making
Better Sense of the Material World.
• 91% of year 4 students and 85% of year 8
students enjoyed science and had a positive view
towards it. |
• Many
students at both levels were successful in carrying
out experimental procedures and reporting results.
For example, year 4 students were able to carry out
tests to identify unknown household powders.
• Students indicated that they experienced a varied
science programme. Field trips and doing experiments
were strong first preferences at both year levels.
• Student performance was consistent across school
types (full primary – intermediate), school sizes,
community sizes and geographic zones.
|
 |
CONCERNS
• While year 8 girls performed worse than boys on about
30% of tasks in both 1995 and 1999, the gap has increased
for year 4 students (10% of tasks in 1995, 25% in 1999).
• The evidence related to the socio-economic index
continues to show that students in high socio-economic decile
schools are generally doing better than students in medium
decile schools, with a bigger gap between students in medium
and low decile schools.
 • While
many students were able to observe and predict
during practical work, they had difficulty explaining
related scientific phenomena. • While
many students were able to observe and predict
during practical work, they had difficulty explaining
related scientific phenomena.
•
Students demonstrated ability to carry out some aspects
of scientific investigations but often were unable
to link all of the necessary aspects into a complete
process.
|
LOOKING
AHEAD –
SUGGESTIONS FOR PROGRESS
• There was only modest progress in achievement from
year 4 to year 8 in Planet Earth and Beyond tasks. Perhaps
this pattern will change now there are new resources available
in this strand.
• Recognition of the value of replication (repeating
experimental steps, observations and measurements) has increased
a little since 1995, but there is still considerable room
for improvement.
• In science, as in other areas of the school curriculum,
students continue to demonstrate ability in observing and
describing but interpretation and drawing conclusions presents
more difficulty. Continuing emphasis on these skills is desirable.
• Although a perception exists that the Living World
has historically been given strong emphasis, the data show
that students are performing inconsistently in this strand. |
|
|
 CLICK for
full report CLICK for
full report
|
GOOD
NEWS
• Results in both making and responding to art
indicate a general pattern of improvement in knowledge
and skills over the four year period between year 4
and year 8.
• The most substantial improvement is in the
area of observational drawing.
• Good percentages of year 4 and year 8 students
could make broad distinctions between pairs of art
works and recognise successful and less successful
picture making skills. |
• The performance of year 4 and year 8 students on
art making tasks was consistent across school size and
type, gender, ethnicity and geographic location.
• The open ended assessment activities have allowed
for imaginative and skilled responses to emerge. Some children
at both year 4 and year 8 have demonstrated fresh and original
work.
• Children continue to enjoy art, rating it as their
favourite school activity at year 4 and second at year
8. Students have retained an enthusiasm for art and a willingness
to continue to learn more about it. This is a powerful
motivation which assists teachers to further develop rich
learning opportunities. |
 |
CONCERNS
• In the years between year 4 and year 8 there is little
development shown in both the making and the responding to
artwork, with the exception of drawing.
• The results indicate that while drawing appears to
be emphasised in current classroom practice, there seems to
be inadequate provision of activities such as printmaking,
collage, weaving, working with clay and fabrics. In fact, according
to 80% of students these activities are rarely if ever experienced.
• Large percentages of year 4 and year 8 students were
not very skilful in analysing and explaining or even describing
a range of observable features in a variety of artworks. Responses
tended to be broad and generalised, without much recognition
of distinguishing detail or narrative. Many year 4 and year
8 students struggled to identify materials, tools and processes
used to make art objects that are not uncommon in New Zealand.
• At year 8, nearly half of the children said they had
no idea of how their teachers perceived their artwork. This
seems to indicate little real feedback of standards, skills,
strengths and weaknesses from teachers to their students.
• A very wide range of performance in art was evident.
Differences were especially apparent by year 8 between low
decile schools and the rest, indicating a polarisation of achievement
levels in our schools.
|
LOOKING
AHEAD –
SUGGESTIONS FOR PROGRESS
Student learning could be improved by:
• Incorporating into art programmes regular opportunities
to practise critical viewing of artworks in different media
and contexts by analysing, explaining and describing a range
of observable features and opinions or feelings about an artwork.
 • Selecting
and making use of a range of suitable resources that
will demonstrate ways of responding to artworks. • Selecting
and making use of a range of suitable resources that
will demonstrate ways of responding to artworks.
• Reference to NEMP Art Assessment Results 1999, which
give a range of exemplars that celebrate what students are
able to achieve under test conditions without teacher input.
• Providing opportunities for regular feedback to students
about their artwork, including strategies for improvement.
 • Ensuring
that long-term planning incorporates a range of processes,
including both two and three dimensional activities
in sufficient depth to ensure the development of
skills and knowledge in these areas. • Ensuring
that long-term planning incorporates a range of processes,
including both two and three dimensional activities
in sufficient depth to ensure the development of
skills and knowledge in these areas. |
|
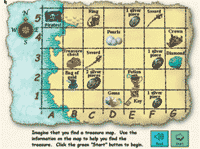
GRAPHS,
TABLES and MAPS 1999 |
 |
|
 CLICK for
full report CLICK for
full report
|
GOOD
NEWS
• The tasks used practical, real life examples
and the teacher administrators at the forum remarked
on the enthusiastic and confident way the students
received them.
• Over 80% of year 8 students have mastered the
basic skills of interpreting and constructing or completing
graphs, tables and maps.
• In tasks where there was room for growth, there
was a substantial improvement between year 4 and year
8. |
• When tested on the same tasks, year 4 students
showed improvements between 1995 and 1999. There was a
small improvement (3% more students succeeding) in interpreting
and extracting information, and a larger improvement (12%
more students succeeding) in constructing or completing
graphs, tables and maps.
• Year 4 students read single dimension pie, line
and bar graphs with good success.
• School type (intermediate or full primary), school
size, geographic zone and student gender did not seem to
predict achievement.
• There were few tasks on which boys and girls performed
significantly differently, with a very slight trend towards
girls performing better at year 8.
• It is noteworthy that a small curriculum change
in the sequencing of teaching during the mid ‘90s
appears to have resulted in an improvement in the ability
of year 4 students in 1999 to label pie graphs. |
 |
CONCERNS
• Year 8 students did not show growth in achievement
from 1995 to 1999, although growth potential was limited, with
many tasks already having a success rate of over 90% in 1995.
In constructing and completing graphs they showed little or
no change, whereas in interpreting and extracting information
there was a very small decline in performance (2% less students
succeeding).
• Many students struggled on tasks which require the
integrating of information from several sources, processing
information and applying higher order thinking. Tasks involving
two or three steps to find an answer were generally not answered
as well as simple, one step questions.
• On average there was significantly lower achievement
by students in low decile schools on 50% of year 4 tasks, and
84% of year 8 tasks. This widening gap is a concern.
|
LOOKING
AHEAD –
SUGGESTIONS FOR PROGRESS
• There continues to be a need for emphasis on conventions
required for presenting graphs, tables and maps, such as the
labelling of axes, recording of units, use of scales, latitude
and longitude, and the use of keys.
• Teachers need to continue giving students opportunities
and encouragement to analyse and interpret tabular and graphical
material which requires comparisons or relationships between
two or more pieces of information.
|
|
|
CLICK for
Assessment Results for Mäori Students 1999
CLICK for
Te Whakaputanga
Whakaaro –
Mäori Forum Comment 1999
|
There
is much to be positive about in the 1999 NEMP results. The
gains Mäori have made at year 4 in comparison to 1995
are significant in the 3 areas assessed: Science, Art, Maps,
tables and graphs.
There were only small changes in the three areas at year 8. |
 |
SCIENCE
• At the year 4 level in 1999 Mäori and non-Mäori
performed similarly on 88% of the tasks compared with 42% in
1995. This shows substantial improvement in Mäori student
achievement at this year level.
• There was little change for Mäori at year 8. In
1999 Mäori performed similarly to non-Mäori on 54%
of the tasks compared with 49% in 1995.
• Students (Mäori and non-Mäori) in medium
and high decile schools consistently outperform children in
low decile schools. More than half of the Mäori children
are in low decile schools.
Given this, it is notable that in 1999:-
• Year 4 students in high decile schools out-performed
students in lower decile schools on 54% of the tasks, but non-Mäori
out-performed Mäori (who are mainly in low decile schools)
in only 12% of tasks.
|
 •
One could have expected the extent of difference in achievement
between high and low decile schools to be reflected in
the non-Mäori and Mäori comparisons however,
the difference was not as great. •
One could have expected the extent of difference in achievement
between high and low decile schools to be reflected in
the non-Mäori and Mäori comparisons however,
the difference was not as great.
Moving
forward
The 1999 results show that where there were significant differences
between Mäori and non-Mäori (as with non-Mäori
in other sub groups) they tended to be on tasks that involved:
–
predicting
– explaining
– interpreting
– integrating information and evaluating
The challenge for educators is to continue to provide a variety
of learning and teaching situations that engage children
in these thinking processes whilst at the same time increasing
their literacy levels within and across the science strands.
|
 |
ART
• In 1999 year 4 Mäori students performed significantly
better than their peers did in 1995. Mäori and non Mäori
performed similarly on all of the tasks in 1999, compared with
two thirds of the tasks in 1995.
• At year 8 this pattern was reversed. Though Mäori
performed similarly on 9 of the 12 tasks in 1999, in 1995 Mäori
performed similarly on all tasks.
• The differences were more apparent in the tasks that
required children to explain ideas and describe features about
art.
• Mäori children’s attitudes at both year
levels were positive. Mäori children enjoyed art and wanted
to continue learning about art.
Moving forward
It is important that educators continue to provide rich experiences
that focus on art literacy and challenge children to use all
their thinking processes, especially those that target analysis,
integrating information and making judgements. |
 |
GRAPHS,
TABLES AND MAPS
• At year 4 level, the difference in performance between
Mäori and non-Mäori decreased dramatically, with
Mäori students performing similarly on 67% of all tasks
compared with 19% in 1995. There was a marginal decline at
year 8.
• It is encouraging that younger Mäori students
are making such progress given their over-representation
in low decile schools.
Moving forward
The challenge for educators is to continue to actively employ
the teaching of critical thinking and problem solving strategies
within contexts which are cognitively demanding. The promotion
of effective analysis of questions, interpreting information
and transferring knowledge and skills across contexts is
crucial to the success of Mäori students, as it is for
all learners. |
| |
|
|
• 1999 is the first year that NEMP has reported on the performance
of Pacific Island students. Schools with more than 10% Pacific Island
students were identified and the performance of Ma¯ori, Pacific
Island and ‘other’
students in these schools compared.
• In all three curriculum areas the Pacific Island students
performed less well than other students on a substantial proportion
of the tasks. These differences were particularly noticeable in one-to-one
tasks that involved articulating knowledge, and explaining ideas
and concepts. This suggests the importance of targeted language enrichment
strategies, both in early childhood and primary education.
|
 |
| |
|



 • While
many students were able to observe and predict
during practical work, they had difficulty explaining
related scientific phenomena.
 • Selecting
and making use of a range of suitable resources that
will demonstrate ways of responding to artworks.
 • Ensuring
that long-term planning incorporates a range of processes,
including both two and three dimensional activities
in sufficient depth to ensure the development of
skills and knowledge in these areas.


 •
One could have expected the extent of difference in achievement
between high and low decile schools to be reflected in
the non-Mäori and Mäori comparisons however,
the difference was not as great.