|
FOCUS / FORUM
INDEX
|
 |
In 2008, the Forum Comment,
was relaunched as the Focus
reflecting the closer comment from
NEMP and the panel of educators. |
 |
|
Main Index for Focus / Forum
Introduction
to Focus / Forum
He
Whakaputanga Whakaaro –
Introduction for Mäori
Medium forums
|
| Forums by year of assessment |
|
|
|
Science
Art
Graphs, Tables & Maps
|
|
|
|
Music
Aspects of Technology
Reading & Speaking |
|
|
|
Information
Skills
Social Studies
Mathematics |
|
 |
|
Listening
& Viewing
Health & Phys. Ed.
Writing |
|
| Forums for Mäori Medium |
|
|
|
Science
Art
Graphs, Tables & Maps
|
|
|
|
Music
Aspects of Technology
Reading & Speaking |
|
|
|
Information
Skills
Social Studies
Mathematics |
|
 |
|
Listening
& Viewing
Health & Phys. Ed.
Writing |
|
|
|
|
|
 |
|
 |
|
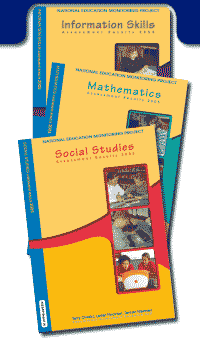
CLICK
on reports above to go directly
to comments |
|
2006
FORUM
PARTICIPANTS
Sandra Aikin
Kaye Ballantyne
Sylvia Barber
Sue Callaghan
Sandra Cubitt
Fiona Ell
Laurel Fitzgerald
Gwen Gawith
Mary Hill
Rhys Hill
Sheena Holding
Malcolm Hyland
John Laurenson
Nila Lemisio
Anna Little
Lynne McGovern
Rosemary Neal-King
Liz Patara
Beth Scarlett
Robyn Shaw
Wayne Southgate
Gillian Thomas
Diana Tregoweth
Amanda Van Rooy
Helen Walters
Seth Willingham
Susan Young |
|
The third
four-year cycle of national monitoring started in 2003.
Results from this third cycle allow comparisons with performances
in the previous cycle of assessments.
The three reports on the 2005 assessment results were considered
by a national forum of teachers, subject specialists, representatives
of national organisations and government agencies. Their
comments highlight what students are generally doing well,
and those areas where improvements are desirable.
The help of principals, teachers and Boards of Trustees in
making NEMP reports and this Forum Comment widely known is
encouraged and appreciated.
 |
Click
the Access Task icon for more information
about the tasks which will be available
to schools from November 2006. |
|
|
|
 CLICK for
full report CLICK for
full report
|
GOOD
NEWS
• Most year 4 students, but particularly girls
and Pasifika students, were enthusiastic about looking
for information.
• Most year 4 and year 8 students were successful
in using the index of an atlas.
• Most year 8 students showed that they were
able to use computer catalogues and find information
in a reference book.
|
• Most
year 8 students were successful in taking notes from
visual sources (e.g. video) when headings were provided
for them.
• Most year 8 students could combine arguments and
material from two or more paragraphs of information.

|
 |
CONCERNS
• Many year 4 and year 8 students found it difficult
to select/reject information relevant to a topic and to make
decisions or develop arguments based on that information.
• More than 50 percent of both year 4 and year 8 students
struggled to ask two or three ‘strong questions’ for
an enquiry, even when working collaboratively.
• Few year 4 and year 8 students could describe a coherent
process or strategy for finding and using information for a
research or study topic.
• Year 8 students often performed well on simple single
step task components but were challenged by tasks that required
multiple steps and simple reasoning.
• The internet is seen as the most preferred source of
information for students. The declining use of libraries is
a concern given the value of resources they can provide.
• While the internet was the most preferred source of
information, there is evidence in the report that students
lacked skills of discernment and discrimination in their use
of internet information.
|
LOOKING
AHEAD –
• Students need modelling to help them develop an argument
and make decisions based on information. They would also benefit
from constructive teacher-student dialogue to help them to ‘mine’
information more deeply, to analyse and interpret it.
• There is evidence that many students are only able
to process information in a superficial way. Students need
guidelines to help them to process this information more effectively.
• Students need help in recognising and knowing when
information is relevant, appropriate and authoritative.
• More emphasis needs to be placed on teaching students
to summarise and paraphrase when taking notes.
• Information skills have relevance across the curriculum.
Students would benefit particularly from teaching, modelling
and guided practice in the process of finding and using information
within authentic contexts of science, social studies, technology
and health at all levels.
• The NEMP information skills framework (p10 of report)
provides a useful outline of skills and processes that are
important for students to learn. |
|
|
 CLICK for
full report CLICK for
full report
|
GOOD
NEWS
• Scores were generally maintained at both year
4 and year 8 over the four-year trend period (2001 – 2005)
on the majority of the 38 trend tasks in areas of number,
algebra, geometry and statistics
• For some tasks the gains were strong. Some small
yet worthwhile gains were made in tasks involving reasoning,
logic, finding patterns, estimation and identifying sequences.
Useful gains from year 4 to year 8 were made across almost
all tasks. |
•
Year 8 students showed moderate growth in their overall ability
to use effective strategies and processes in multiplication.
• There were few differences in achievement on the
basis of gender. Boys and girls performed similarly on the
majority of tasks.
• There have been reduced disparities from 2001 to
2005 in overall scores between Pakeha and Pasifika students,
and Pakeha and Mäori students.
|
• Disparities
between performances of students in high, medium and low decile
schools have reduced from 2001 to 2005.
• The percentage of year 4 students who did not know what
their parents thought of their mathematics achievement reduced
markedly from 2001 to 2005.
• Both year 4 and year 8 students rated mathematics as
one of the top three subjects
in popularity, which suggests positive attitudes towards the
subject. |
|
 |
CONCERNS
• There was a marked decline in recall of basic number
facts and in solving simple number problems, particularly at
year 4.
• Ability to calculate with fractions continues to be a
weakness for a large number of students (e.g. less than half
of year 8 students could calculate 1⁄2 + 1⁄4 or 1 – 1/3).
• Many students were unable to calculate simple percentage
discounts on prices (e.g. 10% off $4.50).
• Many students were able to calculate uncomplicated, single
step problems but stumbled when problems involved multiple steps
or subtleties.
• There are continuing disparities in achievement for students
in low decile schools.
• Only about half of year 8 students knew how to answer
division tasks involving remainders, such as 14 ÷ 3. |
LOOKING
AHEAD –
•
Help students to improve and maintain their recall
of basic facts. This will aid their ability to
perform arithmetical processes.
• Place emphasis on students discussing,
explaining and clarifying their mathematical ideas,
understandings and processes.
• Place additional emphasis on students’ abilities
to calculate with simple fractions.
• Help students develop strategies for approaching
and solving mathematical problems that require
more than simple, one-step processes.
• As with all subjects, identify individuals
and groups of students who have weaknesses in key
skills and processes and direct teaching and regular
instructional guidance to those students. |
|
 |
 CLICK for
full report CLICK for
full report
|
GOOD
NEWS
• Year 4 students have shown moderate improvement
over two consecutive four-year periods.
• A high proportion of students indicated
that they had opportunities to learn about Mäori
culture and protocols, although performance in
this area was not strong.
|
• Year
4 and Year 8 students were moderately successful
in identifying issues in school conflict situations.
• Students’ ideas about good citizenship
focused predominantly on personal and interpersonal
qualities – qualities that are important in the
classroom and the wider community.
• Boys and girls achieved equally well in social
studies.
• Mäori and Pasifika students showed particularly
positive attitudes towards social studies. They out-performed
Pakeha students on tasks that were particularly related
to their life experiences.
• Most year 4 students were positive about doing
social studies at school and about learning and doing
more social studies in the future.
|
 |
CONCERNS
• From 1997 to 2005 there was no change in overall
performance for year 8 students.
• Students’ understandings of issues and situations
tend to be at the superficial, rather than deeper, conceptual
level.
• There is a marked decline between year 4 and year
8 in how much students feel they are learning in social
studies.
• The Resources and Economic Activities strand has
been identified as particularly challenging for teachers
and students.
• Only about half of the year 4 students were able
to talk about any current issues or events (local, national
or international).
|
LOOKING
AHEAD –
• There is a continued need to make social studies
teaching and learning more explicit.
• Students perform well when they perceive contexts
for learning or assessment to be within the scope of their
social experiences (e.g. Mäori students scored higher
than Pakeha students on tasks where they had more experience).
• “Living in the future” was highly regarded
by students as something in which they have great interest.
This area holds potential for school-level programme development
because students do not see it as a current strength of
their programmes.
• The NEMP assessment framework shows the interrelatedness
that exists across social studies knowledge, understandings,
processes, and attitudes. Explicit recognition of these
connections could usefully support teaching and learning. |
|
|
INFORMATION
SKILLS |
 GOOD
NEWS GOOD
NEWS
•
There was a moderate difference
between Mäori and
Pakeha achievement at both
year levels, but the difference
was smaller for year 8
students.
• Year 8 Mäori
students performed particularly
well on 10 tasks covering
library skills. They also
performed well on six tasks
involving classifying and
organising ideas.
|
CONCERNS
• Mäori students had great difficulty
using information and criteria to make and justify
appropriate decisions. In this area, the disparity
between Mäori and Pakeha students increased
from year 4 to year 8 (over 11 tasks). The same applied
to identifying valid points and constructing an argument.
• Mäori students had difficulty with processes
of identifying and linking relevant information. |
|
MATHEMATICS |
GOOD
NEWS
 •
Averaged across all tasks, there were moderate
differences between Mäori and Pakeha performance
at both year levels in mathematics. •
Averaged across all tasks, there were moderate
differences between Mäori and Pakeha performance
at both year levels in mathematics.
 •
The percentage of tasks on which year 4 students
in low decile schools scored lower decreased from
85 percent in 1997, and 87 percent in 2001, to
62 percent this time. An improvement of about half
this size occurred for year 8 Mäori students. •
The percentage of tasks on which year 4 students
in low decile schools scored lower decreased from
85 percent in 1997, and 87 percent in 2001, to
62 percent this time. An improvement of about half
this size occurred for year 8 Mäori students.
• Year 4 Mäori students remain more
positive than Pakeha about learning mathematics
at school. |
CONCERNS
• Those concerns identified for non-Mäori
students apply equally to Mäori students. |
|
SOCIAL
STUDIES |
GOOD
NEWS
• Averaged across all tasks, there were moderate
differences between Mäori and Pakeha performance
at both year levels, with small reductions in disparity
at both year levels between 2001 and 2005.
• The percentage of tasks on which year 4
students in low decile schools scored lower than
students in high decile schools decreased by 14
percent compared to the 2001 assessments.
 •
Mäori students performed better than Pakeha
students on tasks that related to their particular
life experiences. •
Mäori students performed better than Pakeha
students on tasks that related to their particular
life experiences.
• Year 4 Mäori students had more positive
attitudes than Pakeha students in wanting to do
more social studies and learn about people and
their livelihoods. |
CONCERNS
• Despite the gains being made by Mäori
students, continuing disparity between Mäori
and Pakeha student achievement remains a concern. |
|
|
|
 |
ISSN 1174-247X
|
|
|