|
FOCUS / FORUM
INDEX
|
 |
In 2008, the Forum Comment,
was relaunched as the Focus
reflecting the closer comment from
NEMP and the panel of educators. |
 |
|
Main Index for Focus / Forum
Introduction
to Focus / Forum
He
Whakaputanga Whakaaro –
Introduction for Mäori
Medium forums
|
| Forums by year of assessment |
|
|
|
Science
Art
Graphs, Tables & Maps
|
|
|
|
Music
Aspects of Technology
Reading & Speaking |
|
|
|
Information
Skills
Social Studies
Mathematics |
|
 |
|
Listening
& Viewing
Health & Phys. Ed.
Writing |
|
| Forums for Mäori Medium |
|
|
|
Science
Art
Graphs, Tables & Maps
|
|
|
|
Music
Aspects of Technology
Reading & Speaking |
|
|
|
Information
Skills
Social Studies
Mathematics |
|
 |
|
Listening
& Viewing
Health & Phys. Ed.
Writing |
|
|
|
|
|
 |
|
 |
|
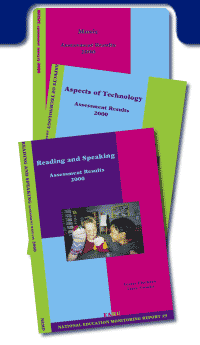
CLICK
on reports above to go directly
to comments |
|
FORUM
PARTICIPANTS
Sandie Aikin
Barbara Auton
Jeanne Biddulph
Roger Buckton
Tina Cartwright
Megan Chambers
Alison Chissell
Peter Corrigan
Cedric Croft
Janet Davies
Merryn Dunmill
Val Fergusson
Maina Field
Mike Forret
Cathy Gibbs
Alison Gilmore
Denise Gordon
Ray Griffiths
Cedric Hall
Julie Hepburn
Louise Hitchings
James Irving
Frances Kelly
Diane Leggett
Margaret Lelieveld
Ian Livingstone
Judith Nepia
Liz Patara
David Philips
Wi Pohatu
Lyn Price
Tracy Rohan
Juliet Small
Jim Strachan
Marama Taiwhati
Gloria Takuira
Martin Te Moni
Robyn Trinick
Wendy Turnbull |
|
The
second four-year cycle of national monitoring started
in 1999. Results from this second cycle allow reporting
of achievement trends over four year intervals, by comparing
performances on tasks used in both the current and previous
cycle of assessments.
It is not the role of NEMP to pass judgment and enter debate.
That is the role of schools, communities and others with
an interest in the educational achievements of students.
NEMP reports provide well-researched findings to inform
their discussion.
The three reports on the 2000 assessment results were considered
by a national forum of curriculum and assessment specialists,
teachers and representatives of national educational organizations.
Their comments highlight what students are generally doing
well, and those areas where improvements are desirable.
The help of principals, teachers and Boards of Trustees
with making NEMP reports and the subsequent Forum Comments
widely known is encouraged and appreciated.
 |
Click
the Access
Task icon
for more
information
about those
tasks which
have been
made available
to schools
since 2001. |
|
|
|
 CLICK for
full report CLICK for
full report
|
GOOD
NEWS
• Results show that there have been small gains
in some aspects of music learning since the 1996
survey, with no areas showing significant deterioration.
• More than 80 percent of students at year
4 and year 8 enjoy music and look forward to future
participation.
• Students enjoyed the practical and varied
nature of the assessment tasks.
|
|
 |
CONCERNS
•
The results of the ‘responding to music’ tasks
indicate that many children are unable to demonstrate
their perception of musical elements such as rhythm,
dynamics, and instrumentation, and their impact in a
piece of music.
• Although children report that they are positive
about listening to music as an in- and out-of-school
activity, it is clear from the results that focussed
listening experiences are limited.
• The survey results show that children want to
play instruments but opportunities to do so in school
are distinctly limited.
• Although
there is a marginal improvement in achievement in some
creative tasks sicne 1996, children reported few opportunities
to create music. Overall results are weak in this area.
• Students from low, medium and high decile schools
performed differently on a substantial number of tasks.
|
LOOKING
AHEAD –
SUGGESTIONS FOR PROGRESS
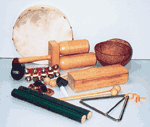 •
Students express positive attitudes to music learning and
participation, yet the overall level of achievement shows
much scope for improvement. Quality resources, ongoing professional
development and programme support for teachers are needed
to attain quality outcomes in line with the intentions of
music in the Arts curriculum. •
Students express positive attitudes to music learning and
participation, yet the overall level of achievement shows
much scope for improvement. Quality resources, ongoing professional
development and programme support for teachers are needed
to attain quality outcomes in line with the intentions of
music in the Arts curriculum.
|
|
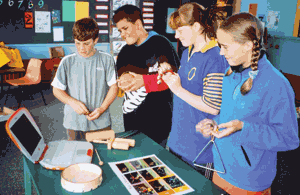
ASPECTS
OF TECHNOLOGY 2000 |
 |
|
 CLICK for
full report CLICK for
full report
|
GOOD
NEWS
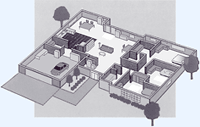
• Students’ perception of technology had
broadened since 1996, beyond a high tech/computer focus
to one that includes other aspects such as designing
and making.
• Most students continue to enjoy technology
(85 percent of year 4 and 93 percent of year 8) and
indicate a positive perception of their expertise. |
• There
is an improvement in students’ ability to highlight
relevant technological features, as exemplified in the Puppet
Make-Up task.
• There is substantial improvement from year 4 to
year 8 in presenting annotated two-dimensional and three-dimensional
diagrams.
• Students performed equally well regardless of geographical
region, community size, school size and school type (full
primary or intermediate). |
 |
 CONCERNS CONCERNS
• Students in lower decile schools were less successful
than those in medium decile schools, and in turn, high decile
schools.
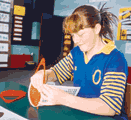
• Students rarely identified social or environmental
issues in decision making during technological practice, unless
these issues were explored directly (e.g. Timber Factory task).
• There is evidence of the influence of traditional
gender patterns in technology at year 8.
|
LOOKING
AHEAD –
SUGGESTIONS FOR PROGRESS
•
Students have demonstrated growth in some, but not all
aspects of technology between 1996 and 2000. Continued
teacher education and resource development are required.
 •
Learning experiences need to move students beyond designing
and making, to a deeper understanding of technology as
embedded in society. This requires tasks in a variety of
cultural contexts, and identification of social issues
within technological problem solving. •
Learning experiences need to move students beyond designing
and making, to a deeper understanding of technology as
embedded in society. This requires tasks in a variety of
cultural contexts, and identification of social issues
within technological problem solving.
• Appropriate
support for technology education should be readily available
to lower decile schools. |
|
READING
AND SPEAKING 2000 |
 |
|
 CLICK for
full report CLICK for
full report
|
READING: GOOD
NEWS
• Results show a very substantial improvement
from 1996 to 2000 in the oral reading of year 4 students.
The percentage of students performing well above the
expected level increased from 32 to 48 percent, and
the percentage performing well below the expected level
dropped from 11 to 6 percent.
• Smaller improvement from 1996 to 2000 was evident
for year 8 students. Five percent more students scored
above the expected level and three percent fewer students
scored well below the expected level. |
• For both year 4 and year 8 students, 90 percent
of reading comprehension questions were answered as well
or better in 2000 than in 1996.
• Reading in their own time was highly valued by
about 80 percent of the students, with fiction the most
popular choice.
• Students in 2000 had markedly greater confidence
in their own reading ability.
SPEAKING: GOOD
NEWS
• On average, 15 percent more year 8 than year
4 students were successful on the components of speaking
tasks. This shows useful progress from year 4 to year
8.
• The gap in speaking achievement between boys
and girls at year 4 is much reduced by year 8. (Boys
performed significantly less well on 7 tasks at year
4, but only 2 tasks at year 8).
• School size, community size and school type did
not seem to be important factors in achievement on speaking
tasks. |
 |
READING: CONCERNS
• While the proportion of students reading poorly has
decreased considerably, there are still students causing concern,
particularly in lower decile schools.
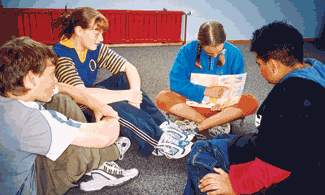
• Feedback by teachers to students is a concern.
More than 20 percent of year 4 and year 8 students felt
their teachers never told them what they needed to improve
at in their reading.
 SPEAKING: CONCERNS SPEAKING: CONCERNS
• Students in low decile schools performed less
well than students in high decile schools on 13 of the
15 tasks at year 4, and nine of the 16 tasks at year
8. Year 4 boys performed less well than girls in seven
of the 13 speaking tasks. By year 8, however, differences
were found on just two tasks.
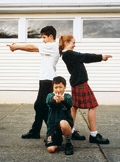 •
The lack of ability to hold an audience through the use of
expressive, descriptive language and dramatisation remains
a concern. •
The lack of ability to hold an audience through the use of
expressive, descriptive language and dramatisation remains
a concern.
|
READING: LOOKING
AHEAD –
SUGGESTIONS FOR PROGRESS
•
All students will thrive best if reading materials reflect
and build upon the experiences and knowledge students bring
to school. Particular care in selecting and using reading
material is required for students of diverse cultural backgrounds.
• Teachers need to foster students’ development
as readers through specific feedback.
• While there is much encouraging news in this report
and in other studies of literacy achievement in New Zealand,
there is still substantial scope for teacher development
which reinforces and builds on best practice.
SPEAKING: LOOKING
AHEAD –
SUGGESTIONS FOR PROGRESS
The results suggest that, in the classroom, teachers need
to focus on:
• Establishing a good foundation for the Government’s
emphasis on literacy by giving emphasis to oral language
in junior classes, especially in lower decile schools.
• Giving explicit targeted feedback so that students
have a clear understanding of their next learning steps.
• Providing more opportunities for students to hold
their audience through utilizing expressive and descriptive
language, and through dramatisation.
• Providing students with more opportunities to understand
language structures and to learn oral language skills,
e.g. formulating and answering questions.
• Teaching students to select appropriate oral language
for given situations, so that they gain the skills and
confidence to succeed in a wide range of situations. |
|
|
CLICK for
Assessment Results for Mäori Students 2000

CLICK for
Te Whakaputanga
Whakaaro –
Mäori Forum Comment 2000
|
MUSIC
• In 2000, year 4 Maori students performed as well as
non-Maori on 62 percent of tasks and better than non-Maori
on a tasks that involved rhythm. There are gains from year
4 to year 8: year 8 Maori students performed as well as non-Maori
on 76 percent of tasks.
It is disappointing that these percentages are somewhat lower
than 1996
• Year 4 Maori students were more positive about singing
at school than non-Maori students, and they pursued this
interest more outside of school. Year 4 students (including
Maori students) in lower decile schools spent more time dancing,
moving and composing music out of school.
• The tasks on which non-Maori students performed significantly
better largely involved skill in analysing music, suggesting
that private music tuition and other organised music experiences
are boosting their musical development.
Looking
Ahead –
Suggestions for Progress
The Maori students need to further develop musical
literacies through:
•
Reading music
• Understanding music terminology
• Using a variety of musical instruments
• Having opportunities to create and compose
music
|
 |
ASPECTS
OF TECHNOLOGY
• In 2000, year 4 Maori students performed comparably
to non-Maori students on 47 percent of the tasks, although
in 1996 they had performed comparably on 89 percent of the
tasks. Maori students have not experienced some of the gains
that non-Maori students have made.
• In 2000, year 8 Maori students performed comparably
on 35 percent of the tasks, compared to 84 percent of the
tasks in 1996. Again, there is a significant decline for
Maori students over the four years.
• Year 4 Maori students reported using computers more
often in school, but were less positive about their ability
in technology. Compared to Maori year 8 students, non-Maori
students reported more frequent use of computers outside
school.
There were no tasks with a Maori context in 2000. |
 |
READING
& SPEAKING
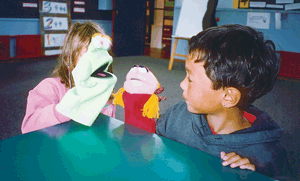
• In 2000, the improvement from year 4 to year 8 in
reading and speaking was considerable for Maori students.
Year 4 Maori students performed comparably to non-Maori students
on only six percent of reading tasks, but by year 8 this
had increased to 47 percent. The trend was similar but less
pronounced for speaking tasks; at year 4, Maori students
performed as well as non-Maori students in 33 percent of
tasks and by year 8 this had increased to 57 percent.
• Though there was marked improvement from year 4 to
year 8, at year 8 comprehension still remains an area of
concern for Maori students. Non-Maori students achieved significantly
better than Maori students on nine reading tasks, seven of
which assessed comprehension.
• Maori children in year 4 and year 8 performed significantly
better than non-Maori on tasks that involved reading in Maori.
• A special analysis showed that Maori year 4 students
shared in the major improvement in oral reading between 1996
and 2000. They showed a similar rate of improvement to all
year 4 students. The average performance for Maori year 4
students in 2000 equalled the average performance for all
year 4 students in 1996. Unfortunately, the gap widened on
comprehension tasks.
 Looking
Ahead – Suggestions for Progress Looking
Ahead – Suggestions for Progress
These results suggest that, to improve Maori students’
comprehension, the following need further development:
•
Prior discussion and questioning
• Vocabulary building
• Practice with new vocabulary
• Scanning and extracting information
• Application of knowledge
|
ACHIEVEMENTS
OF PACIFIKA STUDENTS |
 |
|
The
achievement of Pacific students could not be studied in
the main NEMP samples because the number of Pacific students
was too small. However, a supplementary sample of schools
with more than 15 percent Pacific students allowed comparison
of Pacific, Maori and other students in these schools.
MUSIC
Year 4 Pacific students performed better than Maori and
other students on a keyboard playing tasks, and comparably
on other tasks. Year 8 Pacific students performed as well
as Maori students but a little less well than other students
(except on singing tasks).
ASPECTS
OF TECHNOLOGY
Pacific
students performed better than Maori students but a little
worse than other students at both year 4 and year 8.
 READING READING
Year 4 Pacific students performed at least as well
as Maori students and almost as well as other students.
Year 8 Pacific students scored almost as well as Maori
students but markedly less well than other students.
SPEAKING
Pacific and Maori students scored lower than other
students on all oral presentation tasks at year 4 but
this gap had closed by year 8.
|
|
 |
ISSN 1174-247X
|
top
of the page | return to Forum
Comments index | Reports Menu | Key
Features | Site
Map
|